📊 System Monitoring: Build Your Own Monitoring Dashboard
📚 What You'll Learn
By the end of this lesson, you will be able to:
- Build a sampling loop that reads system metrics on a fixed interval and stores them
- Distinguish a gauge (an instantaneous value like memory or disk percent) from a counter (an ever-increasing total like bytes sent)
- Compute a rate from a counter as the delta between two samples divided by the elapsed interval
- Collect CPU, memory, disk, and network metrics with
psutil - Explain why
psutil.cpu_percent(interval=1)blocks to measure a delta while a bare call returns a meaningless first value
⏱️ Estimated Time: 45–60 minutes
🎯 Project: Build a small monitor that samples CPU, memory, and network on an interval and prints a rate for at least one counter metric.
Imagine having X-ray vision for your computer systems - seeing every process, every byte of memory, every network packet, and every disk operation in real-time. System monitoring transforms you from a reactive firefighter to a proactive system architect. Let's build monitoring tools that would make enterprise solutions jealous! 🔍
The Complete Monitoring Architecture
Think of system monitoring as your digital nervous system. Sensors (metrics collectors) continuously gather data, the brain (analysis engine) processes it, and the nervous system (alerting) responds to threats. Just like a Formula 1 pit crew monitors every aspect of a race car, we'll monitor every aspect of our systems!
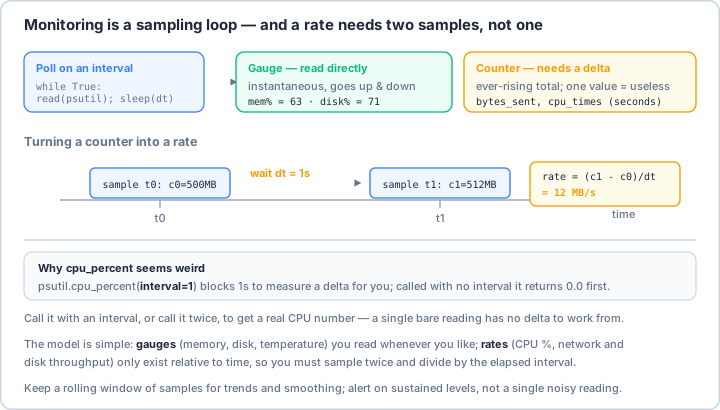
psutil.cpu_percent(interval=1) blocks a second to measure a delta for you; a bare call has no previous sample and returns 0.0.Real-World Scenario: The DevOps Command Center 🎮
You're responsible for a distributed application running on 50 servers. You need to monitor system health, detect anomalies before they become outages, predict capacity needs, and provide real-time dashboards to stakeholders. Let's build a monitoring system that rivals commercial solutions!
import psutil
import platform
import socket
import time
import json
import sqlite3
import threading
from datetime import datetime, timedelta
from typing import Dict, List, Optional, Tuple, Any, Callable
from dataclasses import dataclass, asdict
from collections import deque, defaultdict
import numpy as np
from flask import Flask, jsonify, render_template_string
import plotly.graph_objs as go
import plotly.utils
import logging
import warnings
import os
import subprocess
import re
from enum import Enum
import asyncio
import aiohttp
import smtplib
from email.mime.text import MIMEText
from email.mime.multipart import MIMEMultipart
class MetricType(Enum):
"""Types of metrics."""
GAUGE = "gauge" # Point-in-time value (e.g., CPU usage)
COUNTER = "counter" # Cumulative value (e.g., total requests)
HISTOGRAM = "histogram" # Distribution of values
SUMMARY = "summary" # Statistical summary
@dataclass
class Metric:
"""Single metric data point."""
name: str
value: float
timestamp: datetime
type: MetricType
tags: Dict[str, str] = None
unit: str = None
description: str = None
@dataclass
class Alert:
"""Alert definition."""
name: str
condition: str
threshold: float
severity: str # critical, warning, info
message: str
cooldown: int = 300 # seconds between alerts
actions: List[str] = None
class SystemMonitor:
"""
Comprehensive system monitoring with real-time metrics,
historical data, and intelligent alerting.
"""
def __init__(self, config: Dict = None):
self.config = config or self.get_default_config()
self.metrics_buffer = deque(maxlen=10000)
self.alerts_config = []
self.alert_history = deque(maxlen=1000)
self.collectors = {}
self.running = False
self.threads = []
# Initialize components
self.setup_logging()
self.setup_database()
self.setup_collectors()
self.anomaly_detector = AnomalyDetector()
self.performance_analyzer = PerformanceAnalyzer()
# Metrics cache for quick access
self.current_metrics = {}
self.metrics_history = defaultdict(lambda: deque(maxlen=1000))
def get_default_config(self) -> Dict:
"""Get default monitoring configuration."""
return {
'collection_interval': 5, # seconds
'retention_days': 30,
'db_path': 'monitoring.db',
'alert_channels': ['log', 'email', 'webhook'],
'web_port': 5000,
'enable_predictions': True,
'enable_anomaly_detection': True
}
def setup_logging(self):
"""Setup logging configuration."""
logging.basicConfig(
level=logging.INFO,
format='%(asctime)s - %(name)s - %(levelname)s - %(message)s'
)
self.logger = logging.getLogger(__name__)
def setup_database(self):
"""Setup SQLite database for metrics storage."""
self.db_path = self.config['db_path']
conn = sqlite3.connect(self.db_path)
cursor = conn.cursor()
# Create metrics table
cursor.execute('''
CREATE TABLE IF NOT EXISTS metrics (
id INTEGER PRIMARY KEY AUTOINCREMENT,
name TEXT NOT NULL,
value REAL NOT NULL,
timestamp DATETIME NOT NULL,
type TEXT,
tags TEXT,
unit TEXT,
description TEXT
)
''')
cursor.execute('CREATE INDEX IF NOT EXISTS idx_name_timestamp ON metrics (name, timestamp)')
# Create alerts table
cursor.execute('''
CREATE TABLE IF NOT EXISTS alerts (
id INTEGER PRIMARY KEY AUTOINCREMENT,
alert_name TEXT NOT NULL,
severity TEXT,
message TEXT,
timestamp DATETIME NOT NULL,
resolved BOOLEAN DEFAULT FALSE,
resolved_at DATETIME
)
''')
cursor.execute('CREATE INDEX IF NOT EXISTS idx_timestamp ON alerts (timestamp)')
conn.commit()
conn.close()
def setup_collectors(self):
"""Setup metric collectors."""
self.collectors = {
'system': SystemMetricsCollector(),
'process': ProcessMetricsCollector(),
'network': NetworkMetricsCollector(),
'disk': DiskMetricsCollector(),
'custom': CustomMetricsCollector()
}
def start_monitoring(self):
"""Start monitoring system."""
if self.running:
self.logger.warning("Monitoring already running")
return
self.running = True
# Start collection thread
collection_thread = threading.Thread(target=self._collection_loop)
collection_thread.daemon = True
collection_thread.start()
self.threads.append(collection_thread)
# Start processing thread
processing_thread = threading.Thread(target=self._processing_loop)
processing_thread.daemon = True
processing_thread.start()
self.threads.append(processing_thread)
# Start alert checking thread
alert_thread = threading.Thread(target=self._alert_loop)
alert_thread.daemon = True
alert_thread.start()
self.threads.append(alert_thread)
self.logger.info("System monitoring started")
def stop_monitoring(self):
"""Stop monitoring system."""
self.running = False
# Wait for threads to complete
for thread in self.threads:
thread.join(timeout=5)
self.logger.info("System monitoring stopped")
def _collection_loop(self):
"""Main collection loop."""
while self.running:
try:
# Collect metrics from all collectors
for name, collector in self.collectors.items():
metrics = collector.collect()
# Add to buffer and current metrics
for metric in metrics:
self.metrics_buffer.append(metric)
self.current_metrics[metric.name] = metric
self.metrics_history[metric.name].append(
(metric.timestamp, metric.value)
)
# Store metrics in database
self._store_metrics()
# Sleep until next collection
time.sleep(self.config['collection_interval'])
except Exception as e:
self.logger.error(f"Collection error: {e}")
def _processing_loop(self):
"""Process collected metrics."""
while self.running:
try:
# Anomaly detection
if self.config.get('enable_anomaly_detection'):
self._detect_anomalies()
# Performance analysis
self._analyze_performance()
# Cleanup old data
self._cleanup_old_data()
time.sleep(30) # Process every 30 seconds
except Exception as e:
self.logger.error(f"Processing error: {e}")
def _alert_loop(self):
"""Check alerts continuously."""
while self.running:
try:
self._check_alerts()
time.sleep(10) # Check every 10 seconds
except Exception as e:
self.logger.error(f"Alert checking error: {e}")
def _store_metrics(self):
"""Store metrics in database."""
if not self.metrics_buffer:
return
conn = sqlite3.connect(self.db_path)
cursor = conn.cursor()
# Batch insert metrics
metrics_data = []
while self.metrics_buffer:
metric = self.metrics_buffer.popleft()
metrics_data.append((
metric.name,
metric.value,
metric.timestamp,
metric.type.value,
json.dumps(metric.tags) if metric.tags else None,
metric.unit,
metric.description
))
cursor.executemany(
'''INSERT INTO metrics
(name, value, timestamp, type, tags, unit, description)
VALUES (?, ?, ?, ?, ?, ?, ?)''',
metrics_data
)
conn.commit()
conn.close()
def _detect_anomalies(self):
"""Detect anomalies in metrics."""
for metric_name, history in self.metrics_history.items():
if len(history) < 20: # Need enough data
continue
values = [v for _, v in history]
# Check for anomalies
anomaly = self.anomaly_detector.detect(values)
if anomaly:
self.logger.warning(f"Anomaly detected in {metric_name}: {anomaly}")
self._trigger_alert(
f"anomaly_{metric_name}",
'warning',
f"Anomaly detected in {metric_name}: {anomaly}"
)
def _analyze_performance(self):
"""Analyze system performance."""
analysis = self.performance_analyzer.analyze(self.current_metrics)
if analysis.get('issues'):
for issue in analysis['issues']:
self.logger.warning(f"Performance issue: {issue}")
def _cleanup_old_data(self):
"""Clean up old data from database."""
retention_days = self.config['retention_days']
cutoff_date = datetime.now() - timedelta(days=retention_days)
conn = sqlite3.connect(self.db_path)
cursor = conn.cursor()
cursor.execute(
"DELETE FROM metrics WHERE timestamp < ?",
(cutoff_date,)
)
cursor.execute(
"DELETE FROM alerts WHERE timestamp < ? AND resolved = TRUE",
(cutoff_date,)
)
conn.commit()
conn.close()
def add_alert(self, alert: Alert):
"""Add alert configuration."""
self.alerts_config.append(alert)
self.logger.info(f"Added alert: {alert.name}")
def _check_alerts(self):
"""Check all configured alerts."""
for alert in self.alerts_config:
try:
# Evaluate alert condition
if self._evaluate_alert_condition(alert):
self._trigger_alert(
alert.name,
alert.severity,
alert.message
)
except Exception as e:
self.logger.error(f"Error checking alert {alert.name}: {e}")
def _evaluate_alert_condition(self, alert: Alert) -> bool:
"""Evaluate if alert condition is met."""
# Here `condition` is the metric NAME to watch (e.g.
# "system.cpu.usage"), so look up its current value...
metric = self.current_metrics.get(alert.condition)
if not metric:
return False
# ...and fire when it exceeds the configured threshold. All the
# alerts defined below are "value above threshold" checks; if you
# need < or == comparisons, add a separate `operator` field to
# Alert and branch on it here rather than parsing the metric name.
return metric.value > alert.threshold
def _trigger_alert(self, name: str, severity: str, message: str):
"""Trigger an alert."""
alert_data = {
'name': name,
'severity': severity,
'message': message,
'timestamp': datetime.now()
}
# Check cooldown
if self._check_alert_cooldown(name):
return
# Store in history
self.alert_history.append(alert_data)
# Store in database
conn = sqlite3.connect(self.db_path)
cursor = conn.cursor()
cursor.execute(
'''INSERT INTO alerts (alert_name, severity, message, timestamp)
VALUES (?, ?, ?, ?)''',
(name, severity, message, datetime.now())
)
conn.commit()
conn.close()
# Send notifications
self._send_alert_notifications(alert_data)
def _check_alert_cooldown(self, alert_name: str) -> bool:
"""Check if alert is in cooldown period."""
# Find last alert with same name
for alert in reversed(self.alert_history):
if alert['name'] == alert_name:
time_diff = (datetime.now() - alert['timestamp']).seconds
if time_diff < 300: # 5 minute cooldown
return True
return False
def _send_alert_notifications(self, alert_data: Dict):
"""Send alert notifications through configured channels."""
for channel in self.config.get('alert_channels', ['log']):
if channel == 'log':
self.logger.warning(f"ALERT: {alert_data}")
elif channel == 'email':
self._send_email_alert(alert_data)
elif channel == 'webhook':
self._send_webhook_alert(alert_data)
def _send_email_alert(self, alert_data: Dict):
"""Send email alert."""
# Implement email sending
pass
def _send_webhook_alert(self, alert_data: Dict):
"""Send webhook alert."""
# Implement webhook sending
pass
def get_current_metrics(self) -> Dict:
"""Get current metric values."""
return {
name: {
'value': metric.value,
'timestamp': metric.timestamp.isoformat(),
'unit': metric.unit
}
for name, metric in self.current_metrics.items()
}
def get_metric_history(self, metric_name: str,
hours: int = 1) -> List[Tuple]:
"""Get metric history."""
cutoff = datetime.now() - timedelta(hours=hours)
conn = sqlite3.connect(self.db_path)
cursor = conn.cursor()
cursor.execute(
'''SELECT timestamp, value FROM metrics
WHERE name = ? AND timestamp > ?
ORDER BY timestamp''',
(metric_name, cutoff)
)
results = cursor.fetchall()
conn.close()
return results
class SystemMetricsCollector:
"""Collect system-wide metrics."""
def collect(self) -> List[Metric]:
"""Collect system metrics."""
metrics = []
timestamp = datetime.now()
# CPU metrics
cpu_percent = psutil.cpu_percent(interval=1)
metrics.append(Metric(
name="system.cpu.usage",
value=cpu_percent,
timestamp=timestamp,
type=MetricType.GAUGE,
unit="percent"
))
# Per-CPU metrics
cpu_percents = psutil.cpu_percent(interval=1, percpu=True)
for i, percent in enumerate(cpu_percents):
metrics.append(Metric(
name=f"system.cpu.core{i}",
value=percent,
timestamp=timestamp,
type=MetricType.GAUGE,
unit="percent",
tags={"core": str(i)}
))
# CPU frequency
cpu_freq = psutil.cpu_freq()
if cpu_freq:
metrics.append(Metric(
name="system.cpu.frequency",
value=cpu_freq.current,
timestamp=timestamp,
type=MetricType.GAUGE,
unit="MHz"
))
# Memory metrics
memory = psutil.virtual_memory()
metrics.extend([
Metric(
name="system.memory.usage",
value=memory.percent,
timestamp=timestamp,
type=MetricType.GAUGE,
unit="percent"
),
Metric(
name="system.memory.used",
value=memory.used,
timestamp=timestamp,
type=MetricType.GAUGE,
unit="bytes"
),
Metric(
name="system.memory.available",
value=memory.available,
timestamp=timestamp,
type=MetricType.GAUGE,
unit="bytes"
)
])
# Swap metrics
swap = psutil.swap_memory()
metrics.extend([
Metric(
name="system.swap.usage",
value=swap.percent,
timestamp=timestamp,
type=MetricType.GAUGE,
unit="percent"
),
Metric(
name="system.swap.used",
value=swap.used,
timestamp=timestamp,
type=MetricType.GAUGE,
unit="bytes"
)
])
# Load average (Unix only)
if hasattr(os, 'getloadavg'):
load1, load5, load15 = os.getloadavg()
metrics.extend([
Metric(
name="system.load.1min",
value=load1,
timestamp=timestamp,
type=MetricType.GAUGE
),
Metric(
name="system.load.5min",
value=load5,
timestamp=timestamp,
type=MetricType.GAUGE
),
Metric(
name="system.load.15min",
value=load15,
timestamp=timestamp,
type=MetricType.GAUGE
)
])
# System uptime
boot_time = psutil.boot_time()
uptime = time.time() - boot_time
metrics.append(Metric(
name="system.uptime",
value=uptime,
timestamp=timestamp,
type=MetricType.COUNTER,
unit="seconds"
))
return metrics
class ProcessMetricsCollector:
"""Collect process-related metrics."""
def collect(self) -> List[Metric]:
"""Collect process metrics."""
metrics = []
timestamp = datetime.now()
# Process counts
all_pids = psutil.pids()
metrics.append(Metric(
name="processes.total",
value=len(all_pids),
timestamp=timestamp,
type=MetricType.GAUGE
))
# Process states
states = defaultdict(int)
for proc in psutil.process_iter(['status']):
try:
states[proc.info['status']] += 1
except:
pass
for state, count in states.items():
metrics.append(Metric(
name=f"processes.state.{state}",
value=count,
timestamp=timestamp,
type=MetricType.GAUGE,
tags={"state": state}
))
# Top processes by CPU
top_cpu = []
for proc in psutil.process_iter(['pid', 'name', 'cpu_percent']):
try:
if proc.info['cpu_percent'] > 0:
top_cpu.append((
proc.info['name'],
proc.info['cpu_percent']
))
except:
pass
top_cpu.sort(key=lambda x: x[1], reverse=True)
for i, (name, cpu) in enumerate(top_cpu[:5]):
metrics.append(Metric(
name=f"processes.top_cpu.{i}",
value=cpu,
timestamp=timestamp,
type=MetricType.GAUGE,
unit="percent",
tags={"process": name}
))
return metrics
class NetworkMetricsCollector:
"""Collect network metrics."""
def __init__(self):
self.last_io = None
self.last_time = None
def collect(self) -> List[Metric]:
"""Collect network metrics."""
metrics = []
timestamp = datetime.now()
# Network I/O statistics
net_io = psutil.net_io_counters()
# Calculate rates if we have previous data
if self.last_io and self.last_time:
time_delta = (timestamp - self.last_time).total_seconds()
if time_delta > 0:
bytes_sent_rate = (net_io.bytes_sent - self.last_io.bytes_sent) / time_delta
bytes_recv_rate = (net_io.bytes_recv - self.last_io.bytes_recv) / time_delta
packets_sent_rate = (net_io.packets_sent - self.last_io.packets_sent) / time_delta
packets_recv_rate = (net_io.packets_recv - self.last_io.packets_recv) / time_delta
metrics.extend([
Metric(
name="network.bytes.sent.rate",
value=bytes_sent_rate,
timestamp=timestamp,
type=MetricType.GAUGE,
unit="bytes/s"
),
Metric(
name="network.bytes.recv.rate",
value=bytes_recv_rate,
timestamp=timestamp,
type=MetricType.GAUGE,
unit="bytes/s"
),
Metric(
name="network.packets.sent.rate",
value=packets_sent_rate,
timestamp=timestamp,
type=MetricType.GAUGE,
unit="packets/s"
),
Metric(
name="network.packets.recv.rate",
value=packets_recv_rate,
timestamp=timestamp,
type=MetricType.GAUGE,
unit="packets/s"
)
])
# Store current values for next calculation
self.last_io = net_io
self.last_time = timestamp
# Total counters
metrics.extend([
Metric(
name="network.bytes.sent.total",
value=net_io.bytes_sent,
timestamp=timestamp,
type=MetricType.COUNTER,
unit="bytes"
),
Metric(
name="network.bytes.recv.total",
value=net_io.bytes_recv,
timestamp=timestamp,
type=MetricType.COUNTER,
unit="bytes"
)
])
# Network connections
connections = psutil.net_connections()
connection_states = defaultdict(int)
for conn in connections:
if conn.status:
connection_states[conn.status] += 1
for state, count in connection_states.items():
metrics.append(Metric(
name=f"network.connections.{state.lower()}",
value=count,
timestamp=timestamp,
type=MetricType.GAUGE,
tags={"state": state}
))
return metrics
class DiskMetricsCollector:
"""Collect disk metrics."""
def __init__(self):
self.last_io = None
self.last_time = None
def collect(self) -> List[Metric]:
"""Collect disk metrics."""
metrics = []
timestamp = datetime.now()
# Disk usage for all partitions
for partition in psutil.disk_partitions():
try:
usage = psutil.disk_usage(partition.mountpoint)
metrics.extend([
Metric(
name="disk.usage.percent",
value=usage.percent,
timestamp=timestamp,
type=MetricType.GAUGE,
unit="percent",
tags={"mountpoint": partition.mountpoint}
),
Metric(
name="disk.usage.used",
value=usage.used,
timestamp=timestamp,
type=MetricType.GAUGE,
unit="bytes",
tags={"mountpoint": partition.mountpoint}
),
Metric(
name="disk.usage.free",
value=usage.free,
timestamp=timestamp,
type=MetricType.GAUGE,
unit="bytes",
tags={"mountpoint": partition.mountpoint}
)
])
except:
pass
# Disk I/O statistics
disk_io = psutil.disk_io_counters()
if disk_io:
# Calculate rates if we have previous data
if self.last_io and self.last_time:
time_delta = (timestamp - self.last_time).total_seconds()
if time_delta > 0:
read_rate = (disk_io.read_bytes - self.last_io.read_bytes) / time_delta
write_rate = (disk_io.write_bytes - self.last_io.write_bytes) / time_delta
metrics.extend([
Metric(
name="disk.io.read.rate",
value=read_rate,
timestamp=timestamp,
type=MetricType.GAUGE,
unit="bytes/s"
),
Metric(
name="disk.io.write.rate",
value=write_rate,
timestamp=timestamp,
type=MetricType.GAUGE,
unit="bytes/s"
)
])
# Store current values
self.last_io = disk_io
self.last_time = timestamp
# Total counters
metrics.extend([
Metric(
name="disk.io.read.total",
value=disk_io.read_bytes,
timestamp=timestamp,
type=MetricType.COUNTER,
unit="bytes"
),
Metric(
name="disk.io.write.total",
value=disk_io.write_bytes,
timestamp=timestamp,
type=MetricType.COUNTER,
unit="bytes"
)
])
return metrics
class CustomMetricsCollector:
"""Collect custom application metrics."""
def __init__(self):
self.custom_metrics = {}
def register_metric(self, name: str, func: Callable,
unit: str = None, description: str = None):
"""Register a custom metric collector."""
self.custom_metrics[name] = {
'func': func,
'unit': unit,
'description': description
}
def collect(self) -> List[Metric]:
"""Collect custom metrics."""
metrics = []
timestamp = datetime.now()
for name, config in self.custom_metrics.items():
try:
value = config['func']()
metrics.append(Metric(
name=name,
value=value,
timestamp=timestamp,
type=MetricType.GAUGE,
unit=config['unit'],
description=config['description']
))
except Exception as e:
logging.error(f"Error collecting custom metric {name}: {e}")
return metrics
class AnomalyDetector:
"""Detect anomalies in metrics using statistical methods."""
def __init__(self):
self.models = {}
self.threshold_multiplier = 3 # Standard deviations
def detect(self, values: List[float]) -> Optional[str]:
"""Detect anomalies in a series of values."""
if len(values) < 10:
return None
# Calculate statistics
mean = np.mean(values)
std = np.std(values)
latest = values[-1]
# Z-score method
if std > 0:
z_score = abs((latest - mean) / std)
if z_score > self.threshold_multiplier:
return f"Value {latest:.2f} is {z_score:.1f} standard deviations from mean"
# Interquartile range method
q1 = np.percentile(values, 25)
q3 = np.percentile(values, 75)
iqr = q3 - q1
lower_bound = q1 - 1.5 * iqr
upper_bound = q3 + 1.5 * iqr
if latest < lower_bound or latest > upper_bound:
return f"Value {latest:.2f} is outside IQR bounds [{lower_bound:.2f}, {upper_bound:.2f}]"
# Trend detection
if len(values) >= 20:
recent = values[-10:]
older = values[-20:-10]
recent_mean = np.mean(recent)
older_mean = np.mean(older)
change_percent = abs((recent_mean - older_mean) / older_mean * 100)
if change_percent > 50:
direction = "increased" if recent_mean > older_mean else "decreased"
return f"Metric has {direction} by {change_percent:.1f}% recently"
return None
class PerformanceAnalyzer:
"""Analyze system performance and identify issues."""
def analyze(self, metrics: Dict) -> Dict:
"""Analyze current metrics for performance issues."""
issues = []
recommendations = []
# Check CPU usage
cpu_metric = metrics.get('system.cpu.usage')
if cpu_metric and cpu_metric.value > 80:
issues.append(f"High CPU usage: {cpu_metric.value:.1f}%")
recommendations.append("Consider scaling horizontally or optimizing CPU-intensive processes")
# Check memory usage
mem_metric = metrics.get('system.memory.usage')
if mem_metric and mem_metric.value > 85:
issues.append(f"High memory usage: {mem_metric.value:.1f}%")
recommendations.append("Consider increasing RAM or optimizing memory usage")
# Check swap usage
swap_metric = metrics.get('system.swap.usage')
if swap_metric and swap_metric.value > 50:
issues.append(f"High swap usage: {swap_metric.value:.1f}%")
recommendations.append("System is swapping heavily, add more RAM")
# Check disk usage
for name, metric in metrics.items():
if name.startswith('disk.usage.percent'):
if metric.value > 90:
issues.append(f"Critical disk usage: {metric.value:.1f}%")
recommendations.append("Free up disk space immediately")
elif metric.value > 80:
issues.append(f"High disk usage: {metric.value:.1f}%")
recommendations.append("Consider cleaning up disk space")
# Check load average (Unix)
load_metric = metrics.get('system.load.1min')
cpu_count = psutil.cpu_count()
if load_metric and cpu_count:
load_per_cpu = load_metric.value / cpu_count
if load_per_cpu > 2:
issues.append(f"System overloaded: load average {load_metric.value:.2f}")
recommendations.append("System is heavily loaded, investigate running processes")
return {
'issues': issues,
'recommendations': recommendations,
'timestamp': datetime.now()
}
class MonitoringDashboard:
"""Web-based monitoring dashboard using Flask."""
def __init__(self, monitor: SystemMonitor, port: int = 5000):
self.monitor = monitor
self.app = Flask(__name__)
self.port = port
self.setup_routes()
def setup_routes(self):
"""Setup Flask routes."""
@self.app.route('/')
def index():
"""Main dashboard page."""
return render_template_string(self.get_dashboard_template())
@self.app.route('/api/metrics')
def get_metrics():
"""API endpoint for current metrics."""
return jsonify(self.monitor.get_current_metrics())
@self.app.route('/api/metrics/<metric_name>/history')
def get_metric_history(metric_name):
"""API endpoint for metric history."""
history = self.monitor.get_metric_history(metric_name)
return jsonify(history)
@self.app.route('/api/alerts')
def get_alerts():
"""API endpoint for alerts."""
alerts = list(self.monitor.alert_history)
return jsonify(alerts)
def get_dashboard_template(self) -> str:
"""Get HTML template for dashboard."""
return '''
System Monitoring Dashboard
System Monitoring Dashboard
'''
def run(self):
"""Run the dashboard server."""
self.app.run(host='0.0.0.0', port=self.port, debug=False)
# Example usage
if __name__ == "__main__":
# Initialize system monitor
monitor = SystemMonitor()
# Configure alerts
monitor.add_alert(Alert(
name="high_cpu",
condition="system.cpu.usage",
threshold=80,
severity="warning",
message="CPU usage is above 80%"
))
monitor.add_alert(Alert(
name="critical_memory",
condition="system.memory.usage",
threshold=90,
severity="critical",
message="Memory usage is critically high"
))
monitor.add_alert(Alert(
name="disk_space_low",
condition="disk.usage.percent",
threshold=85,
severity="warning",
message="Disk space is running low"
))
# Add custom metrics
custom_collector = monitor.collectors['custom']
# Example: Monitor a specific service
def check_service_status():
"""Check if a service is running."""
try:
# Check if nginx is running
result = subprocess.run(
['systemctl', 'is-active', 'nginx'],
capture_output=True,
text=True
)
return 1 if result.stdout.strip() == 'active' else 0
except:
return 0
custom_collector.register_metric(
"service.nginx.status",
check_service_status,
description="Nginx service status (1=active, 0=inactive)"
)
# Start monitoring
monitor.start_monitoring()
print("✅ System monitoring started")
# Display current metrics
print("\n📊 Current System Metrics:")
time.sleep(6) # Wait for first collection
metrics = monitor.get_current_metrics()
for name, data in sorted(metrics.items())[:10]:
print(f" {name}: {data['value']:.2f} {data.get('unit', '')}")
# Start web dashboard
print("\n🌐 Starting web dashboard on http://localhost:5000")
dashboard = MonitoringDashboard(monitor, port=5000)
try:
# Run dashboard in a separate thread
dashboard_thread = threading.Thread(target=dashboard.run)
dashboard_thread.daemon = True
dashboard_thread.start()
# Keep monitoring running
while True:
time.sleep(10)
# Print any new alerts
if monitor.alert_history:
latest_alert = monitor.alert_history[-1]
print(f"\n⚠️ Alert: {latest_alert['message']}")
except KeyboardInterrupt:
print("\n\nStopping monitoring...")
monitor.stop_monitoring()
print("✅ Monitoring stopped")
Key Takeaways and Best Practices 🎯
- Collect Relevant Metrics: Focus on metrics that matter for your specific use case.
- Set Appropriate Thresholds: Avoid alert fatigue with well-tuned thresholds.
- Use Time-Series Databases: For production, consider InfluxDB or Prometheus for better performance.
- Implement Gradual Alerting: Warning before critical, with appropriate escalation.
- Store Historical Data: Essential for trend analysis and capacity planning.
- Monitor the Monitors: Ensure your monitoring system itself is reliable.
- Correlate Metrics: Look for relationships between different metrics to identify root causes.
System Monitoring Best Practices 📋
System monitoring mastery transforms you from a reactive administrator to a proactive guardian of system health. You can predict issues, optimize performance, and maintain reliability at scale. Whether you're monitoring a single server or a distributed system, these monitoring capabilities are essential for modern infrastructure! 🚀
Pro Tip: Good monitoring is like having a health tracker for your systems - it tells you not just when something's wrong, but helps you prevent problems before they occur. Start with the basics (CPU, memory, disk, network), then add application-specific metrics. Remember the observer effect - monitoring itself uses resources, so be efficient. Use sampling for high-frequency metrics, aggregate data appropriately, and always have a plan for what to do when alerts fire. The best monitoring system is the one that helps you sleep better at night!