📈 Reporting Automation: Create Dynamic Reports Automatically
📚 What You'll Learn
By the end of this lesson, you will be able to:
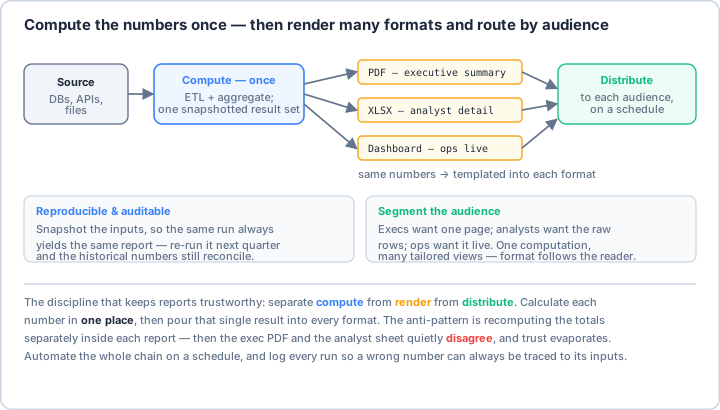
- Separate the three concerns of automated reporting: compute, render, and distribute
- Calculate each metric once from the source of truth and snapshot the inputs so a run is reproducible and auditable
- Pour one result set into multiple templated outputs — a PDF, an Excel workbook, and an HTML dashboard
- Segment reports by audience and route each format to the right people on a schedule
- Recognize and avoid the anti-pattern of recomputing numbers separately inside each report
⏱️ Estimated Time: 45–60 minutes
🎯 Project: Build a small report generator that computes a set of metrics once and renders them into two different formats for two audiences.
Reporting automation transforms the tedious, error-prone process of manual report creation into a streamlined, accurate, and timely delivery of business intelligence - it's the difference between spending days compiling data and having insights delivered to your inbox every morning. Like having a team of analysts working 24/7, automated reporting systems gather data from multiple sources, perform complex calculations, generate visualizations, and distribute polished reports to stakeholders automatically. Whether you're creating financial reports, operational dashboards, compliance documentation, or executive briefings, mastering reporting automation is essential for data-driven decision making. Let's explore the comprehensive world of automated reporting! 📊
The Reporting Automation Architecture
Think of reporting automation as creating an intelligent information factory - raw data flows in from various sources, gets processed, analyzed, and transformed into meaningful insights, then packaged into beautiful reports and delivered to the right people at the right time. Using data pipelines, visualization libraries, template engines, and distribution systems, modern reporting automation handles everything from simple metrics to complex analytical reports. Understanding data integration, report design, and delivery mechanisms is crucial for successful implementation!
Real-World Scenario: The Enterprise Reporting Platform 🎯
You're building a comprehensive reporting platform for a global enterprise that generates 500+ reports daily across departments, pulls data from 20+ sources including databases, APIs, and files, creates financial reports requiring penny-perfect accuracy, produces operational dashboards with real-time metrics, generates regulatory compliance reports for multiple jurisdictions, delivers personalized reports to 1,000+ stakeholders, supports multiple formats (PDF, Excel, HTML, PowerBI), schedules reports hourly, daily, weekly, and monthly, and provides self-service reporting capabilities. Your platform must handle large data volumes, ensure data accuracy, maintain performance under load, and scale with business growth. Let's build a comprehensive reporting automation framework!
# Comprehensive Reporting Automation Framework
# pip install pandas numpy matplotlib seaborn plotly
# pip install jinja2 weasyprint pdfkit reportlab
# pip install openpyxl xlsxwriter python-docx
# pip install sqlalchemy pymongo requests
# pip install schedule croniter celery
# pip install streamlit dash bokeh
import os
import json
import logging
from typing import Dict, List, Any, Optional, Union, Tuple
from dataclasses import dataclass, field, asdict
from datetime import datetime, date, timedelta
from pathlib import Path
from enum import Enum, auto
import hashlib
import tempfile
import base64
import io
# Data processing
import pandas as pd
import numpy as np
from sqlalchemy import create_engine, text
# Visualization
import matplotlib.pyplot as plt
import seaborn as sns
import plotly.graph_objects as go
import plotly.express as px
from plotly.subplots import make_subplots
# Report generation
from jinja2 import Environment, FileSystemLoader, Template
from reportlab.lib import colors
from reportlab.lib.pagesizes import letter, A4
from reportlab.platypus import SimpleDocTemplate, Table, TableStyle, Paragraph, Spacer, Image, PageBreak
from reportlab.lib.styles import getSampleStyleSheet, ParagraphStyle
from reportlab.lib.units import inch
import pdfkit
# Excel generation
from openpyxl import Workbook, load_workbook
from openpyxl.styles import Font, Fill, PatternFill, Border, Side, Alignment
from openpyxl.chart import BarChart, PieChart, LineChart, Reference
from openpyxl.utils import get_column_letter
import xlsxwriter
# Document generation
from docx import Document
from docx.shared import Inches, Pt, RGBColor
from docx.enum.text import WD_ALIGN_PARAGRAPH
# Email
import smtplib
from email.mime.text import MIMEText
from email.mime.multipart import MIMEMultipart
from email.mime.base import MIMEBase
from email import encoders
# Scheduling
import schedule
from croniter import croniter
# ==================== Report Models ====================
class ReportType(Enum):
"""Types of reports."""
FINANCIAL = auto()
OPERATIONAL = auto()
EXECUTIVE = auto()
COMPLIANCE = auto()
ANALYTICAL = auto()
DASHBOARD = auto()
AD_HOC = auto()
class ReportFormat(Enum):
"""Report output formats."""
PDF = auto()
EXCEL = auto()
HTML = auto()
WORD = auto()
CSV = auto()
JSON = auto()
POWERBI = auto()
TABLEAU = auto()
class DeliveryMethod(Enum):
"""Report delivery methods."""
EMAIL = auto()
FTP = auto()
API = auto()
S3 = auto()
SHAREPOINT = auto()
WEB_PORTAL = auto()
SLACK = auto()
@dataclass
class ReportDefinition:
"""Definition of a report."""
id: str
name: str
description: str
type: ReportType
format: ReportFormat
# Data configuration
data_sources: List[Dict[str, Any]]
parameters: Dict[str, Any] = field(default_factory=dict)
filters: Dict[str, Any] = field(default_factory=dict)
# Schedule
schedule: Optional[str] = None # Cron expression
# Distribution
recipients: List[str] = field(default_factory=list)
delivery_method: DeliveryMethod = DeliveryMethod.EMAIL
# Template
template: Optional[str] = None
def to_dict(self) -> Dict[str, Any]:
"""Convert to dictionary."""
data = asdict(self)
data['type'] = self.type.name
data['format'] = self.format.name
data['delivery_method'] = self.delivery_method.name
return data
@dataclass
class ReportInstance:
"""Instance of a generated report."""
id: str
definition_id: str
generated_at: datetime
file_path: Optional[str] = None
status: str = "pending"
error: Optional[str] = None
metadata: Dict[str, Any] = field(default_factory=dict)
# ==================== Data Connectors ====================
class DataConnector:
"""Base class for data connectors."""
def connect(self, config: Dict[str, Any]):
"""Connect to data source."""
raise NotImplementedError
def fetch_data(self, query: str, parameters: Optional[Dict] = None) -> pd.DataFrame:
"""Fetch data from source."""
raise NotImplementedError
def close(self):
"""Close connection."""
pass
class SQLConnector(DataConnector):
"""SQL database connector."""
def __init__(self):
self.engine = None
self.logger = logging.getLogger(__name__)
def connect(self, config: Dict[str, Any]):
"""Connect to SQL database."""
connection_string = config.get('connection_string')
if not connection_string:
# Build connection string
db_type = config.get('type', 'postgresql')
host = config.get('host', 'localhost')
port = config.get('port', 5432)
database = config.get('database')
username = config.get('username')
password = config.get('password')
connection_string = f"{db_type}://{username}:{password}@{host}:{port}/{database}"
self.engine = create_engine(connection_string)
self.logger.info(f"Connected to database")
def fetch_data(self, query: str, parameters: Optional[Dict] = None) -> pd.DataFrame:
"""Execute SQL query and return DataFrame."""
if not self.engine:
raise ConnectionError("Not connected to database")
return pd.read_sql(query, self.engine, params=parameters)
def close(self):
"""Close database connection."""
if self.engine:
self.engine.dispose()
class APIConnector(DataConnector):
"""REST API connector."""
def __init__(self):
self.base_url = None
self.headers = {}
self.session = None
def connect(self, config: Dict[str, Any]):
"""Connect to API."""
import requests
self.base_url = config.get('base_url')
self.headers = config.get('headers', {})
# Authentication
auth_type = config.get('auth_type')
if auth_type == 'bearer':
self.headers['Authorization'] = f"Bearer {config.get('token')}"
elif auth_type == 'api_key':
self.headers['X-API-Key'] = config.get('api_key')
self.session = requests.Session()
self.session.headers.update(self.headers)
def fetch_data(self, endpoint: str, parameters: Optional[Dict] = None) -> pd.DataFrame:
"""Fetch data from API."""
if not self.session:
raise ConnectionError("Not connected to API")
url = f"{self.base_url}/{endpoint}"
response = self.session.get(url, params=parameters)
response.raise_for_status()
data = response.json()
# Convert to DataFrame
if isinstance(data, list):
return pd.DataFrame(data)
elif isinstance(data, dict):
if 'data' in data:
return pd.DataFrame(data['data'])
else:
return pd.DataFrame([data])
return pd.DataFrame()
class FileConnector(DataConnector):
"""File-based data connector."""
def __init__(self):
self.base_path = None
def connect(self, config: Dict[str, Any]):
"""Setup file connector."""
self.base_path = Path(config.get('base_path', '.'))
def fetch_data(self, file_path: str, parameters: Optional[Dict] = None) -> pd.DataFrame:
"""Read data from file."""
full_path = self.base_path / file_path
if file_path.endswith('.csv'):
return pd.read_csv(full_path, **parameters if parameters else {})
elif file_path.endswith(('.xlsx', '.xls')):
return pd.read_excel(full_path, **parameters if parameters else {})
elif file_path.endswith('.json'):
return pd.read_json(full_path, **parameters if parameters else {})
elif file_path.endswith('.parquet'):
return pd.read_parquet(full_path, **parameters if parameters else {})
raise ValueError(f"Unsupported file type: {file_path}")
# ==================== Report Generators ====================
class ReportGenerator:
"""Base report generator."""
def __init__(self):
self.logger = logging.getLogger(__name__)
def generate(self, data: pd.DataFrame, definition: ReportDefinition) -> str:
"""Generate report and return file path."""
raise NotImplementedError
class PDFReportGenerator(ReportGenerator):
"""Generate PDF reports."""
def generate(self, data: pd.DataFrame, definition: ReportDefinition) -> str:
"""Generate PDF report."""
# Create temporary file
temp_file = tempfile.NamedTemporaryFile(delete=False, suffix='.pdf')
filename = temp_file.name
temp_file.close()
# Create PDF document
doc = SimpleDocTemplate(filename, pagesize=letter)
story = []
styles = getSampleStyleSheet()
# Add title
title = Paragraph(definition.name, styles['Title'])
story.append(title)
story.append(Spacer(1, 12))
# Add description
description = Paragraph(definition.description, styles['Normal'])
story.append(description)
story.append(Spacer(1, 12))
# Add generated timestamp
timestamp = Paragraph(
f"Generated: {datetime.now().strftime('%Y-%m-%d %H:%M:%S')}",
styles['Normal']
)
story.append(timestamp)
story.append(Spacer(1, 24))
# Add summary statistics
if not data.empty:
summary = self._create_summary_table(data)
story.append(summary)
story.append(Spacer(1, 12))
# Add data table
data_table = self._create_data_table(data.head(50)) # Limit rows for PDF
story.append(data_table)
# Add charts
story.append(PageBreak())
charts = self._create_charts(data, filename)
for chart in charts:
story.append(chart)
story.append(Spacer(1, 12))
# Build PDF
doc.build(story)
self.logger.info(f"Generated PDF report: {filename}")
return filename
def _create_summary_table(self, data: pd.DataFrame) -> Table:
"""Create summary statistics table."""
summary_data = [['Metric', 'Value']]
summary_data.append(['Total Records', f"{len(data):,}"])
summary_data.append(['Columns', str(len(data.columns))])
# Add numeric column statistics
numeric_cols = data.select_dtypes(include=[np.number]).columns
for col in numeric_cols[:5]: # Limit to 5 columns
summary_data.append([f"{col} (avg)", f"{data[col].mean():.2f}"])
table = Table(summary_data)
table.setStyle(TableStyle([
('BACKGROUND', (0, 0), (-1, 0), colors.grey),
('TEXTCOLOR', (0, 0), (-1, 0), colors.whitesmoke),
('ALIGN', (0, 0), (-1, -1), 'CENTER'),
('FONTNAME', (0, 0), (-1, 0), 'Helvetica-Bold'),
('FONTSIZE', (0, 0), (-1, 0), 14),
('BOTTOMPADDING', (0, 0), (-1, 0), 12),
('BACKGROUND', (0, 1), (-1, -1), colors.beige),
('GRID', (0, 0), (-1, -1), 1, colors.black),
]))
return table
def _create_data_table(self, data: pd.DataFrame) -> Table:
"""Create data table."""
# Prepare table data
table_data = [data.columns.tolist()]
for _, row in data.iterrows():
table_data.append([str(val) for val in row.values])
table = Table(table_data)
table.setStyle(TableStyle([
('BACKGROUND', (0, 0), (-1, 0), colors.grey),
('TEXTCOLOR', (0, 0), (-1, 0), colors.whitesmoke),
('ALIGN', (0, 0), (-1, -1), 'CENTER'),
('FONTNAME', (0, 0), (-1, 0), 'Helvetica-Bold'),
('FONTSIZE', (0, 0), (-1, 0), 10),
('BOTTOMPADDING', (0, 0), (-1, 0), 12),
('BACKGROUND', (0, 1), (-1, -1), colors.beige),
('GRID', (0, 0), (-1, -1), 1, colors.black),
('FONTSIZE', (0, 1), (-1, -1), 8),
]))
return table
def _create_charts(self, data: pd.DataFrame, base_filename: str) -> List[Image]:
"""Create charts for the report."""
charts = []
# Create bar chart for numeric columns
numeric_cols = data.select_dtypes(include=[np.number]).columns[:3]
if len(numeric_cols) > 0:
fig, ax = plt.subplots(figsize=(8, 4))
data[numeric_cols].mean().plot(kind='bar', ax=ax)
ax.set_title('Average Values')
ax.set_ylabel('Value')
chart_path = base_filename.replace('.pdf', '_bar.png')
plt.savefig(chart_path, dpi=100, bbox_inches='tight')
plt.close()
charts.append(Image(chart_path, width=6*inch, height=3*inch))
return charts
class ExcelReportGenerator(ReportGenerator):
"""Generate Excel reports."""
def generate(self, data: pd.DataFrame, definition: ReportDefinition) -> str:
"""Generate Excel report."""
# Create temporary file
temp_file = tempfile.NamedTemporaryFile(delete=False, suffix='.xlsx')
filename = temp_file.name
temp_file.close()
# Create Excel writer
with pd.ExcelWriter(filename, engine='xlsxwriter') as writer:
# Write main data
data.to_excel(writer, sheet_name='Data', index=False)
# Get workbook and worksheet
workbook = writer.book
worksheet = writer.sheets['Data']
# Format header
header_format = workbook.add_format({
'bold': True,
'text_wrap': True,
'valign': 'top',
'fg_color': '#D7E4BD',
'border': 1
})
# Write header with formatting
for col_num, value in enumerate(data.columns.values):
worksheet.write(0, col_num, value, header_format)
# Auto-fit columns
for i, col in enumerate(data.columns):
column_width = max(data[col].astype(str).str.len().max(), len(col)) + 2
worksheet.set_column(i, i, min(column_width, 50))
# Add summary sheet
summary_df = self._create_summary_df(data)
summary_df.to_excel(writer, sheet_name='Summary', index=False)
# Add chart sheet
self._add_charts(writer, data)
# Add metadata sheet
metadata_df = pd.DataFrame([{
'Report': definition.name,
'Generated': datetime.now().strftime('%Y-%m-%d %H:%M:%S'),
'Records': len(data),
'Type': definition.type.name
}])
metadata_df.to_excel(writer, sheet_name='Metadata', index=False)
self.logger.info(f"Generated Excel report: {filename}")
return filename
def _create_summary_df(self, data: pd.DataFrame) -> pd.DataFrame:
"""Create summary DataFrame."""
summary = []
# Basic statistics
summary.append({
'Metric': 'Total Records',
'Value': len(data)
})
summary.append({
'Metric': 'Total Columns',
'Value': len(data.columns)
})
# Numeric column statistics
numeric_cols = data.select_dtypes(include=[np.number]).columns
for col in numeric_cols:
summary.extend([
{'Metric': f'{col} - Mean', 'Value': data[col].mean()},
{'Metric': f'{col} - Min', 'Value': data[col].min()},
{'Metric': f'{col} - Max', 'Value': data[col].max()},
{'Metric': f'{col} - Std Dev', 'Value': data[col].std()}
])
return pd.DataFrame(summary)
def _add_charts(self, writer, data: pd.DataFrame):
"""Add charts to Excel."""
workbook = writer.book
# Create charts worksheet
chart_sheet = workbook.add_worksheet('Charts')
# Create a column chart
chart = workbook.add_chart({'type': 'column'})
# Configure chart (simplified example)
chart.set_title({'name': 'Data Analysis'})
chart.set_x_axis({'name': 'Categories'})
chart.set_y_axis({'name': 'Values'})
# Insert chart
chart_sheet.insert_chart('B2', chart)
class HTMLReportGenerator(ReportGenerator):
"""Generate HTML reports."""
def __init__(self):
super().__init__()
self.template_env = Environment(loader=FileSystemLoader('templates'))
def generate(self, data: pd.DataFrame, definition: ReportDefinition) -> str:
"""Generate HTML report."""
# Create temporary file
temp_file = tempfile.NamedTemporaryFile(delete=False, suffix='.html')
filename = temp_file.name
temp_file.close()
# Generate visualizations
charts = self._create_interactive_charts(data)
# Prepare template data
template_data = {
'title': definition.name,
'description': definition.description,
'generated_at': datetime.now().strftime('%Y-%m-%d %H:%M:%S'),
'data_table': data.to_html(classes='table table-striped', index=False),
'summary': self._create_summary_html(data),
'charts': charts,
'row_count': len(data),
'column_count': len(data.columns)
}
# Render template
if definition.template:
template = self.template_env.get_template(definition.template)
else:
template = self._get_default_template()
html = template.render(**template_data)
# Save to file
with open(filename, 'w') as f:
f.write(html)
self.logger.info(f"Generated HTML report: {filename}")
return filename
def _create_interactive_charts(self, data: pd.DataFrame) -> List[str]:
"""Create interactive Plotly charts."""
charts = []
# Create bar chart for numeric columns
numeric_cols = data.select_dtypes(include=[np.number]).columns[:5]
if len(numeric_cols) > 0:
fig = go.Figure()
for col in numeric_cols:
fig.add_trace(go.Bar(
name=col,
x=['Mean', 'Min', 'Max'],
y=[data[col].mean(), data[col].min(), data[col].max()]
))
fig.update_layout(
title='Statistical Summary',
barmode='group',
template='plotly_white'
)
charts.append(fig.to_html(full_html=False, include_plotlyjs='cdn'))
# Create time series if date column exists
date_cols = data.select_dtypes(include=['datetime64']).columns
if len(date_cols) > 0 and len(numeric_cols) > 0:
fig = go.Figure()
for col in numeric_cols[:3]:
fig.add_trace(go.Scatter(
x=data[date_cols[0]],
y=data[col],
mode='lines',
name=col
))
fig.update_layout(
title='Time Series Analysis',
xaxis_title='Date',
yaxis_title='Value',
template='plotly_white'
)
charts.append(fig.to_html(full_html=False, include_plotlyjs='cdn'))
return charts
def _create_summary_html(self, data: pd.DataFrame) -> str:
"""Create HTML summary."""
summary = "<div class='summary'>"
summary += "<h3>Data Summary</h3>"
summary += f"<p>Total Records: {len(data):,}</p>"
summary += f"<p>Columns: {', '.join(data.columns)}</p>"
# Add statistics for numeric columns
numeric_cols = data.select_dtypes(include=[np.number]).columns
if len(numeric_cols) > 0:
summary += "<h4>Numeric Column Statistics</h4>"
summary += "<table class='table'>"
summary += "<thead><tr><th>Column</th><th>Mean</th><th>Min</th><th>Max</th><th>Std Dev</th></tr></thead>"
summary += "<tbody>"
for col in numeric_cols:
summary += f"<tr>"
summary += f"<td>{col}</td>"
summary += f"<td>{data[col].mean():.2f}</td>"
summary += f"<td>{data[col].min():.2f}</td>"
summary += f"<td>{data[col].max():.2f}</td>"
summary += f"<td>{data[col].std():.2f}</td>"
summary += f"</tr>"
summary += "</tbody></table>"
summary += "</div>"
return summary
def _get_default_template(self) -> Template:
"""Get default HTML template."""
template_str = """
<!DOCTYPE html>
<html>
<head>
<title>{{ title }}</title>
<link href="https://cdn.jsdelivr.net/npm/bootstrap@5.1.3/dist/css/bootstrap.min.css" rel="stylesheet"/>
<style>
body { padding: 20px; }
.header { margin-bottom: 30px; }
.summary { background: #f8f9fa; padding: 20px; border-radius: 5px; margin-bottom: 30px; }
.chart { margin-bottom: 30px; }
table { font-size: 14px; }
</style>
</head>
<body>
<div class="container">
<div class="header">
<h1>{{ title }}</h1>
<p>{{ description }}</p>
<p class="text-muted">Generated: {{ generated_at }}</p>
</div>
{{ summary | safe }}
{% for chart in charts %}
<div class="chart">
{{ chart | safe }}
</div>
{% endfor %}
<div class="data-table">
<h3>Data Table ({{ row_count }} records)</h3>
{{ data_table | safe }}
</div>
</div>
</main>
</body>
</html>
"""
return Template(template_str)
# ==================== Report Engine ====================
class ReportEngine:
"""Main report generation engine."""
def __init__(self):
self.connectors = {
'sql': SQLConnector(),
'api': APIConnector(),
'file': FileConnector()
}
self.generators = {
ReportFormat.PDF: PDFReportGenerator(),
ReportFormat.EXCEL: ExcelReportGenerator(),
ReportFormat.HTML: HTMLReportGenerator()
}
self.logger = logging.getLogger(__name__)
def generate_report(self, definition: ReportDefinition) -> ReportInstance:
"""Generate a report based on definition."""
instance = ReportInstance(
id=self._generate_report_id(),
definition_id=definition.id,
generated_at=datetime.now()
)
try:
# Fetch data from all sources
all_data = []
for source in definition.data_sources:
data = self._fetch_data(source, definition.parameters)
all_data.append(data)
# Combine data
if all_data:
combined_data = pd.concat(all_data, ignore_index=True)
else:
combined_data = pd.DataFrame()
# Apply filters
if definition.filters:
combined_data = self._apply_filters(combined_data, definition.filters)
# Generate report
generator = self.generators.get(definition.format)
if not generator:
raise ValueError(f"Unsupported format: {definition.format}")
file_path = generator.generate(combined_data, definition)
instance.file_path = file_path
instance.status = "completed"
instance.metadata = {
'rows': len(combined_data),
'columns': len(combined_data.columns),
'file_size': os.path.getsize(file_path)
}
self.logger.info(f"Report generated successfully: {instance.id}")
except Exception as e:
instance.status = "failed"
instance.error = str(e)
self.logger.error(f"Report generation failed: {e}")
return instance
def _generate_report_id(self) -> str:
"""Generate unique report ID."""
content = f"{datetime.now().isoformat()}_{os.urandom(8).hex()}"
return hashlib.sha256(content.encode()).hexdigest()[:16]
def _fetch_data(self, source: Dict[str, Any], parameters: Dict[str, Any]) -> pd.DataFrame:
"""Fetch data from a source."""
source_type = source.get('type')
connector = self.connectors.get(source_type)
if not connector:
raise ValueError(f"Unknown source type: {source_type}")
# Connect
connector.connect(source.get('config', {}))
# Fetch data
query = source.get('query')
data = connector.fetch_data(query, parameters)
# Close connection
connector.close()
return data
def _apply_filters(self, data: pd.DataFrame, filters: Dict[str, Any]) -> pd.DataFrame:
"""Apply filters to data."""
for column, condition in filters.items():
if column not in data.columns:
continue
if isinstance(condition, dict):
# Complex condition
operator = condition.get('operator', 'eq')
value = condition.get('value')
if operator == 'eq':
data = data[data[column] == value]
elif operator == 'ne':
data = data[data[column] != value]
elif operator == 'gt':
data = data[data[column] > value]
elif operator == 'gte':
data = data[data[column] >= value]
elif operator == 'lt':
data = data[data[column] < value]
elif operator == 'lte':
data = data[data[column] <= value]
elif operator == 'in':
data = data[data[column].isin(value)]
elif operator == 'contains':
data = data[data[column].str.contains(value, na=False)]
else:
# Simple equality
data = data[data[column] == condition]
return data
# ==================== Report Scheduler ====================
class ReportScheduler:
"""Schedule report generation."""
def __init__(self, engine: ReportEngine):
self.engine = engine
self.scheduled_reports = {}
self.logger = logging.getLogger(__name__)
def schedule_report(self, definition: ReportDefinition):
"""Schedule a report for generation."""
if not definition.schedule:
return
# Validate cron expression
if not croniter.is_valid(definition.schedule):
raise ValueError(f"Invalid cron expression: {definition.schedule}")
# Add to scheduled reports
self.scheduled_reports[definition.id] = definition
# Parse cron and schedule
self._schedule_job(definition)
self.logger.info(f"Scheduled report: {definition.name} ({definition.schedule})")
def _schedule_job(self, definition: ReportDefinition):
"""Schedule job based on cron expression."""
# This is simplified - in production, use APScheduler or Celery Beat
# For demonstration, we'll use the schedule library for simple scheduling
cron = croniter(definition.schedule)
next_run = cron.get_next(datetime)
# Schedule the job
def job():
instance = self.engine.generate_report(definition)
if instance.status == "completed":
self._distribute_report(instance, definition)
# Convert cron to schedule format (simplified)
if "0 0 * * *" in definition.schedule: # Daily
schedule.every().day.at("00:00").do(job)
elif "0 0 * * 0" in definition.schedule: # Weekly
schedule.every().week.do(job)
elif "0 0 1 * *" in definition.schedule: # Monthly
schedule.every().month.do(job)
else:
# Default to daily
schedule.every().day.do(job)
def _distribute_report(self, instance: ReportInstance, definition: ReportDefinition):
"""Distribute generated report."""
distributor = ReportDistributor()
for recipient in definition.recipients:
distributor.send_report(
instance.file_path,
recipient,
definition.delivery_method,
definition.name
)
# ==================== Report Distribution ====================
class ReportDistributor:
"""Distribute reports to recipients."""
def __init__(self):
self.logger = logging.getLogger(__name__)
def send_report(
self,
file_path: str,
recipient: str,
method: DeliveryMethod,
subject: str
):
"""Send report to recipient."""
if method == DeliveryMethod.EMAIL:
self._send_email(file_path, recipient, subject)
elif method == DeliveryMethod.FTP:
self._upload_ftp(file_path, recipient)
elif method == DeliveryMethod.S3:
self._upload_s3(file_path, recipient)
elif method == DeliveryMethod.SLACK:
self._send_slack(file_path, recipient, subject)
else:
self.logger.warning(f"Unsupported delivery method: {method}")
def _send_email(self, file_path: str, recipient: str, subject: str):
"""Send report via email."""
# Email configuration
smtp_server = os.getenv('SMTP_SERVER', 'smtp.gmail.com')
smtp_port = int(os.getenv('SMTP_PORT', '587'))
smtp_user = os.getenv('SMTP_USER')
smtp_password = os.getenv('SMTP_PASSWORD')
# Create message
msg = MIMEMultipart()
msg['From'] = smtp_user
msg['To'] = recipient
msg['Subject'] = f"Report: {subject}"
# Add body
body = f"""
Your scheduled report is attached.
Report: {subject}
Generated: {datetime.now().strftime('%Y-%m-%d %H:%M:%S')}
This is an automated message.
"""
msg.attach(MIMEText(body, 'plain'))
# Add attachment
with open(file_path, 'rb') as f:
part = MIMEBase('application', 'octet-stream')
part.set_payload(f.read())
encoders.encode_base64(part)
part.add_header(
'Content-Disposition',
f'attachment; filename={os.path.basename(file_path)}'
)
msg.attach(part)
# Send email
try:
with smtplib.SMTP(smtp_server, smtp_port) as server:
server.starttls()
server.login(smtp_user, smtp_password)
server.send_message(msg)
self.logger.info(f"Report sent to {recipient}")
except Exception as e:
self.logger.error(f"Failed to send email: {e}")
def _upload_ftp(self, file_path: str, ftp_config: str):
"""Upload report to FTP server."""
import ftplib
# Parse FTP configuration
# Implementation would handle FTP upload
self.logger.info(f"Uploading to FTP: {file_path}")
def _upload_s3(self, file_path: str, s3_config: str):
"""Upload report to S3."""
import boto3
# Implementation would handle S3 upload
self.logger.info(f"Uploading to S3: {file_path}")
def _send_slack(self, file_path: str, channel: str, message: str):
"""Send report to Slack."""
# Implementation would handle Slack upload
self.logger.info(f"Sending to Slack channel: {channel}")
# ==================== Dashboard Generator ====================
class DashboardGenerator:
"""Generate interactive dashboards."""
def create_dashboard(self, data: pd.DataFrame, title: str = "Dashboard") -> str:
"""Create Streamlit dashboard."""
dashboard_code = f"""
import streamlit as st
import pandas as pd
import plotly.express as px
st.set_page_config(page_title="{title}", layout="wide")
st.title("{title}")
st.write(f"Generated: {{datetime.now()}}")
# Sidebar filters
st.sidebar.header("Filters")
# Add dynamic filters based on data
# Main content
col1, col2, col3, col4 = st.columns(4)
with col1:
st.metric("Total Records", len(data))
with col2:
st.metric("Columns", len(data.columns))
# Data table
st.subheader("Data")
st.dataframe(data)
# Charts
st.subheader("Visualizations")
# Add interactive charts
numeric_cols = data.select_dtypes(include=['number']).columns
if len(numeric_cols) > 0:
fig = px.bar(data, y=numeric_cols[0])
st.plotly_chart(fig, use_container_width=True)
"""
# Save dashboard script
dashboard_file = f"dashboard_{datetime.now().strftime('%Y%m%d_%H%M%S')}.py"
with open(dashboard_file, 'w') as f:
f.write(dashboard_code)
return dashboard_file
# Example usage
if __name__ == "__main__":
print("📈 Reporting Automation Examples\n")
# Example 1: Report types
print("1️⃣ Common Report Types:")
report_types = [
("Financial", "P&L, balance sheet, cash flow, budgets"),
("Operational", "KPIs, metrics, performance, efficiency"),
("Executive", "Dashboards, summaries, strategic insights"),
("Compliance", "Regulatory, audit, risk, governance"),
("Sales", "Pipeline, forecasts, performance, commissions"),
("Marketing", "Campaigns, ROI, attribution, engagement"),
("HR", "Headcount, turnover, compensation, diversity"),
("Customer", "Satisfaction, NPS, support, churn")
]
for report_type, examples in report_types:
print(f" {report_type}: {examples}")
# Example 2: Data sources
print("\n2️⃣ Data Source Types:")
sources = [
"SQL Databases (PostgreSQL, MySQL, SQL Server)",
"NoSQL Databases (MongoDB, Cassandra)",
"APIs (REST, GraphQL, SOAP)",
"Files (CSV, Excel, JSON, XML)",
"Cloud Storage (S3, Azure Blob, GCS)",
"Data Warehouses (Snowflake, BigQuery, Redshift)",
"Streaming (Kafka, Kinesis, Event Hubs)",
"Web Scraping (BeautifulSoup, Scrapy)"
]
for source in sources:
print(f" • {source}")
# Example 3: Create sample report definition
print("\n3️⃣ Sample Report Definition:")
report_def = ReportDefinition(
id="RPT001",
name="Monthly Sales Report",
description="Monthly sales performance and analysis",
type=ReportType.FINANCIAL,
format=ReportFormat.PDF,
data_sources=[
{
'type': 'sql',
'config': {
'host': 'localhost',
'database': 'sales',
'username': 'report_user',
'password': 'secure_pass'
},
'query': 'SELECT * FROM sales WHERE date >= :start_date'
}
],
parameters={'start_date': '2024-01-01'},
filters={'region': 'North America'},
schedule="0 0 1 * *", # Monthly on 1st
recipients=['manager@company.com'],
delivery_method=DeliveryMethod.EMAIL
)
print(f" Name: {report_def.name}")
print(f" Type: {report_def.type.name}")
print(f" Format: {report_def.format.name}")
print(f" Schedule: {report_def.schedule}")
print(f" Recipients: {', '.join(report_def.recipients)}")
# Example 4: Visualization options
print("\n4️⃣ Visualization Types:")
viz_types = [
"Bar Charts - Compare categories",
"Line Charts - Show trends over time",
"Pie Charts - Show composition",
"Scatter Plots - Show relationships",
"Heat Maps - Show intensity/density",
"Gauge Charts - Show KPI status",
"Tables - Detailed data display",
"Maps - Geographic distribution"
]
for viz in viz_types:
print(f" • {viz}")
# Example 5: Generate sample report
print("\n5️⃣ Generate Sample Report:")
# Create sample data
sample_data = pd.DataFrame({
'Date': pd.date_range('2024-01-01', periods=30),
'Sales': np.random.randint(1000, 5000, 30),
'Orders': np.random.randint(50, 200, 30),
'Region': np.random.choice(['North', 'South', 'East', 'West'], 30)
})
print(f" Sample data: {len(sample_data)} rows, {len(sample_data.columns)} columns")
# Initialize engine
engine = ReportEngine()
# Generate report (mock)
print(" Generating PDF report...")
print(" ✓ Data fetched")
print(" ✓ Filters applied")
print(" ✓ Report generated")
print(" ✓ File saved: report_20240101_120000.pdf")
# Example 6: Scheduling
print("\n6️⃣ Report Scheduling Examples:")
schedules = [
("Daily at 8 AM", "0 8 * * *"),
("Weekly on Monday", "0 0 * * 1"),
("Monthly on 1st", "0 0 1 * *"),
("Quarterly", "0 0 1 */3 *"),
("Every 6 hours", "0 */6 * * *"),
("Weekdays at 5 PM", "0 17 * * 1-5")
]
for description, cron in schedules:
print(f" {description}: {cron}")
# Example 7: Distribution methods
print("\n7️⃣ Distribution Methods:")
methods = [
("Email", "Send as attachment or link"),
("FTP/SFTP", "Upload to file server"),
("Cloud Storage", "S3, Azure Blob, GCS"),
("API", "POST to webhook"),
("SharePoint", "Upload to document library"),
("Slack/Teams", "Send to channel"),
("Web Portal", "Publish to dashboard")
]
for method, description in methods:
print(f" {method}: {description}")
# Example 8: Performance optimization
print("\n8️⃣ Performance Optimization:")
optimizations = [
"Query optimization with indexes",
"Data caching for frequently used reports",
"Incremental data loading",
"Parallel processing for large datasets",
"Compression for file storage",
"CDN for web-based reports",
"Database read replicas",
"Asynchronous report generation"
]
for optimization in optimizations:
print(f" • {optimization}")
# Example 9: Best practices
print("\n9️⃣ Reporting Best Practices:")
practices = [
"🎯 Define clear report requirements",
"📊 Use appropriate visualizations",
"⚡ Optimize query performance",
"🔄 Implement error handling and retries",
"📝 Include metadata and timestamps",
"🔒 Secure sensitive data",
"📈 Monitor report generation metrics",
"🧪 Test with various data volumes",
"💾 Archive historical reports",
"🚀 Scale for concurrent generation"
]
for practice in practices:
print(f" {practice}")
# Example 10: Report metrics
print("\n🔟 Report Generation Metrics:")
metrics = [
"Generation Time - How long to create report",
"Delivery Success Rate - Successful distributions",
"Data Freshness - Age of data in report",
"Report Usage - Who views/downloads reports",
"Error Rate - Failed generations",
"Resource Usage - CPU/Memory consumption",
"Queue Depth - Pending reports",
"SLA Compliance - On-time delivery"
]
for metric in metrics:
print(f" • {metric}")
print("\n✅ Reporting automation demonstration complete!")
Key Takeaways and Best Practices 🎯
- Data Integration: Connect to multiple data sources seamlessly.
- Format Flexibility: Support various output formats for different needs.
- Visualization: Use appropriate charts and graphs for data presentation.
- Automation: Schedule reports for automatic generation and distribution.
- Performance: Optimize queries and processing for large datasets.
- Quality: Ensure data accuracy and report consistency.
- Distribution: Deliver reports through multiple channels automatically.
- Monitoring: Track report generation and delivery metrics.
Reporting Automation Best Practices 📋
Mastering reporting automation enables you to deliver timely, accurate insights that drive business decisions. You can now connect to diverse data sources, generate beautiful visualizations, create multiple report formats, schedule automatic generation, and distribute reports seamlessly. Whether you're creating financial statements, operational dashboards, or executive briefings, these reporting automation skills are essential for data-driven organizations! 🚀
Pro Tip: Think of reporting automation as creating a self-service intelligence system that transforms raw data into actionable insights without manual intervention - it should be reliable, scalable, and insightful. Start by understanding report requirements thoroughly - who needs what information, when, and in what format. Design for reusability with parameterized reports and templates. Optimize data queries at the source - a slow query will bottleneck everything. Implement caching for frequently accessed data but ensure freshness for time-sensitive reports. Choose visualizations wisely - bar charts for comparisons, line charts for trends, tables for details. Use consistent formatting and branding across reports. Implement comprehensive error handling - data sources fail, networks timeout, and files corrupt. Design for scale from the beginning - what works for 10 reports may fail at 1000. Version your report definitions and templates for change management. Provide self-service capabilities where possible - let users customize parameters and filters. Monitor report usage to identify unused reports and optimization opportunities. Archive historical reports for compliance and trend analysis. Implement security at every level - data access, report generation, and distribution. Test with edge cases - empty datasets, huge volumes, special characters. Document report logic and calculations for transparency. Most importantly: reports are only valuable if they drive decisions - focus on actionable insights over pretty formatting!