📊 Excel Automation with openpyxl: Master Spreadsheets with Python
📚 What You'll Learn
By the end of this lesson, you will be able to:
- Read from and write to
.xlsxworkbooks with openpyxl - Move data through pandas DataFrames for complex operations, then write it back to Excel
- Apply consistent formatting with reusable
NamedStyleobjects - Write Excel formulas so the spreadsheet does the calculating
- Add charts, hyperlinks, data validation, and sheet protection for interactive workbooks
- Handle very large files efficiently with
read_onlyandwrite_onlymodes
⏱️ Estimated Time: 45–60 minutes
🎯 Project: Build an Excel report generator that loads a dataset, formats it with a reusable style, adds a chart and summary formulas, and saves a polished workbook.
Excel is the lingua franca of business data. Love it or hate it, spreadsheets are everywhere. But what if you could harness Excel's power without ever opening it? That's where openpyxl comes in – it's like having a robot accountant who never makes calculation errors and can process thousands of spreadsheets in seconds! 🤖
Beyond Basic Spreadsheet Manipulation
Think of openpyxl as your Swiss Army knife for Excel. It doesn't just read and write cells – it creates charts, applies formulas, formats data beautifully, and even generates complete reports. It's like being able to control Excel with your mind, except your mind is Python!
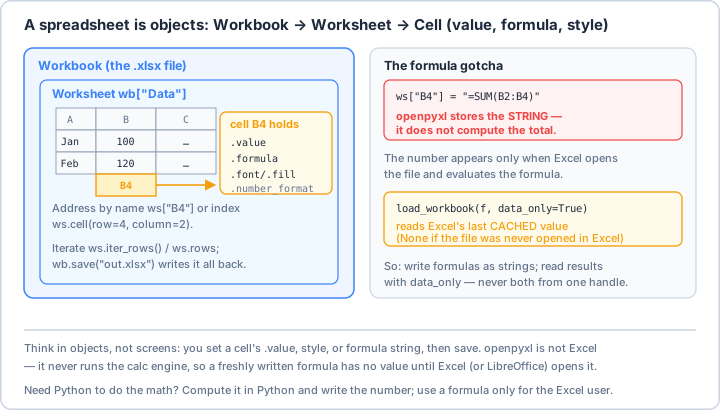
"=SUM(B2:B4)" as a string and never runs the calc engine, so a freshly written formula has no result until Excel opens the file. Need the number in Python? Compute it in Python, or reopen with data_only=True to read Excel's cached value.Real-World Scenario: The Financial Report Automation System 💰
Imagine you're managing financial data for multiple departments. Every month, you need to collect data from various sources, calculate KPIs, create charts, apply corporate formatting, and distribute customized reports to 50 different managers. Let's automate the entire process!
import openpyxl
from openpyxl import Workbook, load_workbook
from openpyxl.styles import Font, PatternFill, Alignment, Border, Side, NamedStyle
from openpyxl.chart import BarChart, PieChart, LineChart, Reference
from openpyxl.chart.series import DataPoint
from openpyxl.utils import get_column_letter, column_index_from_string
from openpyxl.utils.dataframe import dataframe_to_rows
from openpyxl.worksheet.table import Table, TableStyleInfo
from openpyxl.formatting.rule import ColorScaleRule, CellIsRule, FormulaRule
from openpyxl.drawing.image import Image
from datetime import datetime, timedelta
import pandas as pd
import numpy as np
from pathlib import Path
from typing import Dict, List, Optional, Tuple
import json
class ExcelAutomationMaster:
"""
Comprehensive Excel automation system for creating, manipulating,
and formatting professional spreadsheets with advanced features.
"""
def __init__(self, template_path: Optional[str] = None):
self.template_path = Path(template_path) if template_path else None
self.workbook = None
self.styles = self._create_custom_styles()
# Corporate color scheme
self.colors = {
'primary': '1F4788',
'secondary': '4472CA',
'success': '5FA777',
'warning': 'F5B800',
'danger': 'E63946',
'dark': '2D3436',
'light': 'F5F5F5'
}
def _create_custom_styles(self) -> Dict[str, NamedStyle]:
"""Create reusable named styles for consistent formatting."""
styles = {}
# Header style
header_style = NamedStyle(name='header_style')
header_style.font = Font(bold=True, size=12, color='FFFFFF')
header_style.fill = PatternFill(
start_color='1F4788',
end_color='1F4788',
fill_type='solid'
)
header_style.alignment = Alignment(
horizontal='center',
vertical='center',
wrap_text=True
)
header_style.border = Border(
left=Side(style='thin'),
right=Side(style='thin'),
top=Side(style='thin'),
bottom=Side(style='thin')
)
styles['header'] = header_style
# Currency style
currency_style = NamedStyle(name='currency_style')
currency_style.number_format = '$#,##0.00'
currency_style.alignment = Alignment(horizontal='right')
styles['currency'] = currency_style
# Percentage style
percent_style = NamedStyle(name='percent_style')
percent_style.number_format = '0.00%'
percent_style.alignment = Alignment(horizontal='center')
styles['percentage'] = percent_style
# Date style
date_style = NamedStyle(name='date_style')
date_style.number_format = 'YYYY-MM-DD'
date_style.alignment = Alignment(horizontal='center')
styles['date'] = date_style
# Total row style
total_style = NamedStyle(name='total_style')
total_style.font = Font(bold=True, size=11)
total_style.fill = PatternFill(
start_color='E8E8E8',
end_color='E8E8E8',
fill_type='solid'
)
total_style.border = Border(
top=Side(style='double'),
bottom=Side(style='double')
)
styles['total'] = total_style
return styles
def create_workbook(self, sheets: List[str] = None):
"""Create a new workbook with specified sheets."""
self.workbook = Workbook()
# Remove default sheet
self.workbook.remove(self.workbook.active)
# Add custom sheets
if sheets:
for sheet_name in sheets:
self.workbook.create_sheet(sheet_name)
# Register custom styles
for style in self.styles.values():
if style.name not in self.workbook.named_styles:
self.workbook.add_named_style(style)
def load_workbook(self, file_path: str, data_only: bool = False):
"""Load an existing workbook."""
self.workbook = load_workbook(file_path, data_only=data_only)
# Register custom styles if not present
for style in self.styles.values():
if style.name not in self.workbook.named_styles:
self.workbook.add_named_style(style)
def create_financial_report(self, data: pd.DataFrame, sheet_name: str = 'Financial Report'):
"""
Create a comprehensive financial report with formatting, formulas, and charts.
"""
if not self.workbook:
self.create_workbook([sheet_name])
ws = self.workbook[sheet_name]
# Add title
ws['A1'] = f"Financial Report - {datetime.now().strftime('%B %Y')}"
ws['A1'].font = Font(bold=True, size=16, color='1F4788')
ws.merge_cells('A1:H1')
ws['A1'].alignment = Alignment(horizontal='center', vertical='center')
# Add company logo (if available)
try:
logo = Image('company_logo.png')
logo.width = 100
logo.height = 50
ws.add_image(logo, 'A3')
except:
pass # Logo not found
# Start data from row 5
start_row = 5
# Write DataFrame to Excel with headers
for row_num, row in enumerate(dataframe_to_rows(data, index=False, header=True), start_row):
for col_num, value in enumerate(row, 1):
cell = ws.cell(row=row_num, column=col_num, value=value)
# Apply header style
if row_num == start_row:
cell.style = 'header_style'
# Apply data formatting based on column
elif col_num > 1: # Skip first column (usually labels)
if 'revenue' in str(ws.cell(start_row, col_num).value).lower():
cell.style = 'currency_style'
elif 'percent' in str(ws.cell(start_row, col_num).value).lower():
cell.style = 'percent_style'
elif 'date' in str(ws.cell(start_row, col_num).value).lower():
cell.style = 'date_style'
# Add formulas
last_row = ws.max_row
last_col = ws.max_column
# Add total row
total_row = last_row + 2
ws.cell(total_row, 1, "TOTAL")
ws.cell(total_row, 1).style = 'total_style'
for col in range(2, last_col + 1):
col_letter = get_column_letter(col)
formula = f"=SUM({col_letter}{start_row+1}:{col_letter}{last_row})"
cell = ws.cell(total_row, col, formula)
cell.style = 'total_style'
if 'currency' in self.styles:
cell.number_format = '$#,##0.00'
# Add performance indicators
self._add_kpi_dashboard(ws, data, start_row=total_row + 3)
# Add charts
self._add_revenue_chart(ws, start_row + 1, last_row, start_col=last_col + 2)
self._add_pie_chart(ws, start_row + 1, last_row, start_col=last_col + 2, start_row_chart=15)
# Apply conditional formatting
self._apply_conditional_formatting(ws, start_row + 1, last_row)
# Auto-adjust column widths
self._auto_adjust_columns(ws)
# Add data validation
self._add_data_validation(ws)
# Protect formulas
self._protect_formulas(ws)
def _add_kpi_dashboard(self, ws, data: pd.DataFrame, start_row: int):
"""Add a KPI dashboard with key metrics."""
kpi_row = start_row
ws.cell(kpi_row, 1, "KEY PERFORMANCE INDICATORS")
ws.cell(kpi_row, 1).font = Font(bold=True, size=14, color='1F4788')
ws.merge_cells(f'A{kpi_row}:H{kpi_row}')
kpi_row += 2
# Calculate KPIs
if 'Revenue' in data.columns:
total_revenue = data['Revenue'].sum()
avg_revenue = data['Revenue'].mean()
max_revenue = data['Revenue'].max()
min_revenue = data['Revenue'].min()
# Create KPI cards
kpis = [
('Total Revenue', total_revenue, 'currency'),
('Average Revenue', avg_revenue, 'currency'),
('Maximum Revenue', max_revenue, 'currency'),
('Minimum Revenue', min_revenue, 'currency')
]
col = 1
for kpi_name, kpi_value, kpi_format in kpis:
# KPI Label
ws.cell(kpi_row, col, kpi_name)
ws.cell(kpi_row, col).font = Font(bold=True, size=10)
# KPI Value
value_cell = ws.cell(kpi_row + 1, col, kpi_value)
value_cell.font = Font(bold=True, size=12, color='5FA777')
if kpi_format == 'currency':
value_cell.number_format = '$#,##0.00'
# Add a summary formula (SPARKLINE is Google Sheets only and
# shows #NAME? in Excel; use a normal formula instead)
ws.cell(kpi_row + 2, col, f"=AVERAGE(B{6}:B{ws.max_row-3})")
col += 2
def _add_revenue_chart(self, ws, data_start: int, data_end: int, start_col: int):
"""Add a revenue bar chart to the worksheet."""
chart = BarChart()
chart.type = "col"
chart.style = 10
chart.title = "Revenue by Category"
chart.y_axis.title = 'Revenue ($)'
chart.x_axis.title = 'Category'
# Set chart dimensions
chart.width = 15
chart.height = 10
# Add data
data = Reference(ws, min_col=2, min_row=data_start-1,
max_row=data_end, max_col=2)
categories = Reference(ws, min_col=1, min_row=data_start,
max_row=data_end)
chart.add_data(data, titles_from_data=True)
chart.set_categories(categories)
# Customize chart colors
chart.shape = 4
chart.grouping = "clustered"
# Add to worksheet
cell_ref = f"{get_column_letter(start_col)}5"
ws.add_chart(chart, cell_ref)
def _add_pie_chart(self, ws, data_start: int, data_end: int,
start_col: int, start_row_chart: int):
"""Add a pie chart showing distribution."""
pie = PieChart()
pie.title = "Revenue Distribution"
# Add data
data = Reference(ws, min_col=2, min_row=data_start-1,
max_row=data_end, max_col=2)
labels = Reference(ws, min_col=1, min_row=data_start,
max_row=data_end)
pie.add_data(data, titles_from_data=True)
pie.set_categories(labels)
# Add data labels
pie.dataLabels = openpyxl.chart.label.DataLabelList()
pie.dataLabels.showPercent = True
# Position
cell_ref = f"{get_column_letter(start_col)}{start_row_chart}"
ws.add_chart(pie, cell_ref)
def _apply_conditional_formatting(self, ws, start_row: int, end_row: int):
"""Apply conditional formatting to highlight important data."""
# Color scale for revenue column (assuming column B)
color_scale = ColorScaleRule(
start_type='min', start_color='FFF5F5',
mid_type='percentile', mid_value=50, mid_color='FFE5B4',
end_type='max', end_color='90EE90'
)
ws.conditional_formatting.add(f'B{start_row}:B{end_row}', color_scale)
# Highlight high values
high_value = CellIsRule(
operator='greaterThan',
formula=['100000'],
stopIfTrue=True,
fill=PatternFill(start_color='5FA777', end_color='5FA777', fill_type='solid'),
font=Font(bold=True, color='FFFFFF')
)
ws.conditional_formatting.add(f'B{start_row}:B{end_row}', high_value)
# Highlight low values
low_value = CellIsRule(
operator='lessThan',
formula=['10000'],
stopIfTrue=True,
fill=PatternFill(start_color='E63946', end_color='E63946', fill_type='solid'),
font=Font(color='FFFFFF')
)
ws.conditional_formatting.add(f'B{start_row}:B{end_row}', low_value)
def _auto_adjust_columns(self, ws):
"""Auto-adjust column widths based on content."""
for column in ws.columns:
max_length = 0
column = [cell for cell in column if cell.value]
if not column:
continue # Skip fully-empty columns (avoids IndexError below)
for cell in column:
try:
if len(str(cell.value)) > max_length:
max_length = len(str(cell.value))
except:
pass
adjusted_width = min(max_length + 2, 50)
ws.column_dimensions[column[0].column_letter].width = adjusted_width
def _add_data_validation(self, ws):
"""Add data validation rules to ensure data integrity."""
from openpyxl.worksheet.datavalidation import DataValidation
# Example: Add dropdown for status column
dv = DataValidation(
type="list",
formula1='"Pending,Approved,Rejected"',
allow_blank=True,
showErrorMessage=True,
errorTitle='Invalid Entry',
error='Please select from the dropdown list.'
)
# Apply to a specific range (adjust as needed)
# dv.add('E2:E100')
# ws.add_data_validation(dv)
def _protect_formulas(self, ws, password: str = ""):
"""Protect cells containing formulas from editing."""
from openpyxl.worksheet.protection import SheetProtection
# First, unlock all cells
for row in ws.iter_rows():
for cell in row:
cell.protection = openpyxl.styles.Protection(locked=False)
# Then lock only formula cells
for row in ws.iter_rows():
for cell in row:
if cell.value and str(cell.value).startswith('='):
cell.protection = openpyxl.styles.Protection(locked=True)
# Enable worksheet protection
ws.protection = SheetProtection(
sheet=True,
formatCells=False,
formatColumns=False,
formatRows=False,
insertColumns=False,
insertRows=False,
insertHyperlinks=False,
deleteColumns=False,
deleteRows=False,
selectLockedCells=True,
selectUnlockedCells=True,
sort=False,
autoFilter=False,
pivotTables=False,
password=password
)
def create_pivot_table(self, source_data: pd.DataFrame, sheet_name: str = 'Pivot'):
"""Create a pivot table from pandas DataFrame."""
if not self.workbook:
self.create_workbook([sheet_name])
ws = self.workbook[sheet_name]
# Write source data to a hidden sheet
source_sheet = self.workbook.create_sheet('_SourceData')
for row_num, row in enumerate(dataframe_to_rows(source_data, index=False, header=True), 1):
for col_num, value in enumerate(row, 1):
source_sheet.cell(row=row_num, column=col_num, value=value)
# Create pivot table using pandas
pivot = source_data.pivot_table(
index='Category',
values='Revenue',
aggfunc=['sum', 'mean', 'count']
)
# Write pivot table to sheet
ws['A1'] = 'Pivot Table Analysis'
ws['A1'].font = Font(bold=True, size=14, color='1F4788')
start_row = 3
for row_num, row in enumerate(dataframe_to_rows(pivot, index=True, header=True), start_row):
for col_num, value in enumerate(row, 1):
cell = ws.cell(row=row_num, column=col_num, value=value)
if row_num == start_row:
cell.style = 'header_style'
elif isinstance(value, (int, float)):
cell.number_format = '#,##0.00'
# Hide source data sheet
source_sheet.sheet_state = 'hidden'
self._auto_adjust_columns(ws)
def batch_process_files(self, input_folder: str, output_folder: str,
processing_func, **kwargs):
"""
Process multiple Excel files in batch.
"""
input_path = Path(input_folder)
output_path = Path(output_folder)
output_path.mkdir(parents=True, exist_ok=True)
results = []
for excel_file in input_path.glob('*.xlsx'):
print(f"Processing: {excel_file.name}")
try:
# Load file
self.load_workbook(str(excel_file))
# Process
result = processing_func(self.workbook, **kwargs)
# Save processed file
output_file = output_path / f"processed_{excel_file.name}"
self.workbook.save(output_file)
results.append({
'file': excel_file.name,
'status': 'success',
'output': str(output_file),
'result': result
})
except Exception as e:
results.append({
'file': excel_file.name,
'status': 'error',
'error': str(e)
})
print(f" Error: {e}")
return results
def save(self, filename: str):
"""Save the workbook to a file."""
if self.workbook:
self.workbook.save(filename)
print(f"✅ Workbook saved: {filename}")
else:
print("❌ No workbook to save")
class AdvancedExcelOperations:
"""
Advanced Excel operations for complex data manipulation and analysis.
"""
@staticmethod
def merge_multiple_sheets(workbooks: List[str], output_file: str,
merge_on: str = None):
"""
Merge data from multiple Excel files/sheets into one.
"""
all_data = []
for wb_path in workbooks:
wb = load_workbook(wb_path, data_only=True)
for sheet_name in wb.sheetnames:
ws = wb[sheet_name]
# Convert to DataFrame
data = []
headers = None
for row in ws.iter_rows(values_only=True):
if not headers:
headers = row
else:
data.append(row)
if headers and data:
df = pd.DataFrame(data, columns=headers)
df['_source_file'] = Path(wb_path).name
df['_source_sheet'] = sheet_name
all_data.append(df)
# Merge all DataFrames
if all_data:
merged_df = pd.concat(all_data, ignore_index=True)
# If merge_on specified, remove duplicates
if merge_on:
merged_df = merged_df.drop_duplicates(subset=merge_on, keep='last')
# Create output workbook
output_wb = Workbook()
output_ws = output_wb.active
output_ws.title = 'Merged Data'
# Write merged data
for row_num, row in enumerate(dataframe_to_rows(merged_df, index=False, header=True), 1):
for col_num, value in enumerate(row, 1):
output_ws.cell(row=row_num, column=col_num, value=value)
# Apply formatting
for cell in output_ws[1]:
cell.font = Font(bold=True)
cell.fill = PatternFill(start_color='CCCCCC', end_color='CCCCCC', fill_type='solid')
output_wb.save(output_file)
print(f"✅ Merged {len(all_data)} sheets into {output_file}")
return merged_df
return None
@staticmethod
def create_dashboard(data: Dict[str, pd.DataFrame], output_file: str):
"""
Create a multi-sheet dashboard with interconnected data.
"""
wb = Workbook()
# Remove default sheet
wb.remove(wb.active)
# Create overview sheet
overview = wb.create_sheet('Overview')
overview['A1'] = 'Executive Dashboard'
overview['A1'].font = Font(bold=True, size=18, color='1F4788')
overview.merge_cells('A1:F1')
row = 3
# Add summary for each data source
for name, df in data.items():
# Create detailed sheet
detail_sheet = wb.create_sheet(name)
# Write data to detail sheet
for row_num, data_row in enumerate(dataframe_to_rows(df, index=False, header=True), 1):
for col_num, value in enumerate(data_row, 1):
detail_sheet.cell(row=row_num, column=col_num, value=value)
# Add summary to overview
overview.cell(row, 1, name)
overview.cell(row, 1).font = Font(bold=True, size=12)
# Add hyperlink to detail sheet
overview.cell(row, 2, f"View Details")
overview.cell(row, 2).hyperlink = f"#{name}!A1"
overview.cell(row, 2).font = Font(color='0000FF', underline='single')
# Add key metrics
overview.cell(row, 3, f"Records: {len(df)}")
overview.cell(row, 4, f"Columns: {len(df.columns)}")
if 'Revenue' in df.columns:
total_revenue = df['Revenue'].sum()
overview.cell(row, 5, f"Total Revenue: ${total_revenue:,.2f}")
row += 2
# Add navigation buttons to each detail sheet
for sheet_name in wb.sheetnames[1:]: # Skip overview
sheet = wb[sheet_name]
last_row = sheet.max_row + 2
sheet.cell(last_row, 1, "← Back to Overview")
sheet.cell(last_row, 1).hyperlink = "#Overview!A1"
sheet.cell(last_row, 1).font = Font(color='0000FF', underline='single')
wb.save(output_file)
print(f"✅ Dashboard created: {output_file}")
@staticmethod
def apply_complex_formulas(wb_path: str, formulas: Dict[str, str]):
"""
Apply complex formulas across multiple sheets.
Example formulas:
{
'Sheet1!E2:E100': '=IF(D2>1000,D2*0.1,D2*0.05)',
'Summary!B2': '=SUMIFS(Sheet1!D:D,Sheet1!A:A,">2024-01-01")',
'Analysis!C2:C50': '=VLOOKUP(A2,Sheet1!A:D,4,FALSE)'
}
"""
wb = load_workbook(wb_path)
for cell_range, formula in formulas.items():
# Parse sheet and range
if '!' in cell_range:
sheet_name, range_ref = cell_range.split('!')
ws = wb[sheet_name]
# Check if it's a range or single cell
if ':' in range_ref:
# Apply formula to range
start_cell, end_cell = range_ref.split(':')
# Get row and column ranges
from openpyxl.utils.cell import coordinate_from_string
start_col, start_row = coordinate_from_string(start_cell)
end_col, end_row = coordinate_from_string(end_cell)
start_col_idx = column_index_from_string(start_col)
end_col_idx = column_index_from_string(end_col)
# Apply formula to each cell in range
for row in range(start_row, end_row + 1):
for col in range(start_col_idx, end_col_idx + 1):
# Adjust formula for current row/column
# NOTE: illustrative only and fragile - replace('2', ...)
# naively swaps EVERY '2' in the string (e.g. inside 2024,
# 0.25, or column refs). Use a real formula rewriter in production.
adjusted_formula = formula.replace('2', str(row))
ws.cell(row, col).value = adjusted_formula
else:
# Single cell
ws[range_ref] = formula
# Save with formulas
wb.save(wb_path.replace('.xlsx', '_with_formulas.xlsx'))
print(f"✅ Complex formulas applied")
class ExcelReportGenerator:
"""
Generate various types of reports in Excel format.
"""
def __init__(self):
self.master = ExcelAutomationMaster()
def generate_sales_report(self, sales_data: pd.DataFrame, output_file: str):
"""Generate comprehensive sales report with analysis."""
# Create workbook with multiple sheets
self.master.create_workbook([
'Summary', 'Detailed Sales', 'By Product', 'By Region', 'Trends'
])
# Summary Sheet
ws_summary = self.master.workbook['Summary']
self._create_summary_sheet(ws_summary, sales_data)
# Detailed Sales Sheet
ws_detail = self.master.workbook['Detailed Sales']
self._create_detailed_sheet(ws_detail, sales_data)
# By Product Analysis
ws_product = self.master.workbook['By Product']
product_pivot = sales_data.pivot_table(
index='Product',
values=['Revenue', 'Quantity'],
aggfunc={'Revenue': 'sum', 'Quantity': 'sum'}
)
self._write_dataframe(ws_product, product_pivot, "Product Analysis")
# By Region Analysis
ws_region = self.master.workbook['By Region']
region_pivot = sales_data.pivot_table(
index='Region',
values=['Revenue', 'Quantity'],
aggfunc={'Revenue': 'sum', 'Quantity': 'sum'}
)
self._write_dataframe(ws_region, region_pivot, "Regional Analysis")
# Trends Sheet
ws_trends = self.master.workbook['Trends']
self._create_trends_analysis(ws_trends, sales_data)
# Save report
self.master.save(output_file)
def _create_summary_sheet(self, ws, data: pd.DataFrame):
"""Create executive summary sheet."""
# Title
ws['A1'] = 'Sales Report - Executive Summary'
ws['A1'].font = Font(bold=True, size=16, color='1F4788')
ws.merge_cells('A1:F1')
# Key Metrics
row = 3
metrics = [
('Total Revenue', data['Revenue'].sum(), '$#,##0.00'),
('Total Units Sold', data['Quantity'].sum(), '#,##0'),
('Average Order Value', data['Revenue'].mean(), '$#,##0.00'),
('Number of Transactions', len(data), '#,##0'),
('Number of Products', data['Product'].nunique(), '#,##0'),
('Number of Regions', data['Region'].nunique(), '#,##0')
]
for metric_name, metric_value, number_format in metrics:
ws.cell(row, 1, metric_name)
ws.cell(row, 1).font = Font(bold=True)
value_cell = ws.cell(row, 3, metric_value)
value_cell.number_format = number_format
value_cell.font = Font(size=12, color='5FA777')
row += 1
# Add mini chart
chart = LineChart()
chart.title = "Revenue Trend"
chart.width = 10
chart.height = 5
# Assuming data has date column
if 'Date' in data.columns:
daily_revenue = data.groupby('Date')['Revenue'].sum()
# Write data for chart
ws.cell(row + 2, 1, 'Date')
ws.cell(row + 2, 2, 'Revenue')
for i, (date, revenue) in enumerate(daily_revenue.items(), row + 3):
ws.cell(i, 1, date)
ws.cell(i, 2, revenue)
# Add chart data
dates = Reference(ws, min_col=1, min_row=row+3, max_row=row+2+len(daily_revenue))
values = Reference(ws, min_col=2, min_row=row+2, max_row=row+2+len(daily_revenue))
chart.add_data(values, titles_from_data=True)
chart.set_categories(dates)
ws.add_chart(chart, 'E3')
def _create_detailed_sheet(self, ws, data: pd.DataFrame):
"""Create detailed sales data sheet."""
# Write DataFrame
for row_num, row in enumerate(dataframe_to_rows(data, index=False, header=True), 1):
for col_num, value in enumerate(row, 1):
cell = ws.cell(row=row_num, column=col_num, value=value)
if row_num == 1:
cell.font = Font(bold=True, color='FFFFFF')
cell.fill = PatternFill(start_color='1F4788', end_color='1F4788', fill_type='solid')
# Add table
tab = Table(displayName="SalesData", ref=f"A1:{get_column_letter(ws.max_column)}{ws.max_row}")
style = TableStyleInfo(
name="TableStyleMedium2",
showFirstColumn=False,
showLastColumn=False,
showRowStripes=True,
showColumnStripes=False
)
tab.tableStyleInfo = style
ws.add_table(tab)
# Auto-filter
ws.auto_filter.ref = ws.dimensions
def _create_trends_analysis(self, ws, data: pd.DataFrame):
"""Create trends analysis sheet."""
ws['A1'] = 'Sales Trends Analysis'
ws['A1'].font = Font(bold=True, size=14, color='1F4788')
# Monthly trends
if 'Date' in data.columns:
data['Month'] = pd.to_datetime(data['Date']).dt.to_period('M')
monthly_sales = data.groupby('Month')['Revenue'].agg(['sum', 'mean', 'count'])
# Write to sheet
row = 3
ws.cell(row, 1, 'Month')
ws.cell(row, 2, 'Total Revenue')
ws.cell(row, 3, 'Average Revenue')
ws.cell(row, 4, 'Transaction Count')
for month, values in monthly_sales.iterrows():
row += 1
ws.cell(row, 1, str(month))
ws.cell(row, 2, values['sum']).number_format = '$#,##0.00'
ws.cell(row, 3, values['mean']).number_format = '$#,##0.00'
ws.cell(row, 4, values['count']).number_format = '#,##0'
def _write_dataframe(self, ws, df: pd.DataFrame, title: str):
"""Write DataFrame to worksheet with formatting."""
# Title
ws['A1'] = title
ws['A1'].font = Font(bold=True, size=14, color='1F4788')
# Write data
start_row = 3
for row_num, row in enumerate(dataframe_to_rows(df, index=True, header=True), start_row):
for col_num, value in enumerate(row, 1):
cell = ws.cell(row=row_num, column=col_num, value=value)
if row_num == start_row:
cell.font = Font(bold=True)
cell.fill = PatternFill(start_color='E8E8E8', end_color='E8E8E8', fill_type='solid')
if isinstance(value, (int, float)) and col_num > 1:
cell.number_format = '#,##0.00'
# Example usage
if __name__ == "__main__":
# Create sample data
np.random.seed(42)
sample_data = pd.DataFrame({
'Date': pd.date_range('2024-01-01', periods=100),
'Product': np.random.choice(['Product A', 'Product B', 'Product C'], 100),
'Region': np.random.choice(['North', 'South', 'East', 'West'], 100),
'Quantity': np.random.randint(1, 50, 100),
'Revenue': np.random.uniform(100, 5000, 100)
})
# Generate financial report
excel_master = ExcelAutomationMaster()
excel_master.create_workbook(['Financial Report'])
excel_master.create_financial_report(sample_data)
excel_master.save('financial_report.xlsx')
# Generate sales report
report_gen = ExcelReportGenerator()
report_gen.generate_sales_report(sample_data, 'sales_report.xlsx')
# Merge multiple files
AdvancedExcelOperations.merge_multiple_sheets(
['report1.xlsx', 'report2.xlsx'],
'merged_report.xlsx',
merge_on='Product'
)
print("✅ Excel automation complete!")
Key Takeaways and Best Practices 🎯
- Use DataFrames as Intermediaries: Convert Excel data to pandas DataFrames for complex operations, then write back to Excel.
- Apply Consistent Styling: Create reusable NamedStyles for consistent formatting across your workbooks.
- Leverage Formulas: Let Excel do calculations with formulas rather than pre-calculating everything in Python.
- Batch Processing: Process multiple files efficiently using loops and consistent patterns.
- Add Interactivity: Use hyperlinks, data validation, and protection to create user-friendly spreadsheets.
- Visualize with Charts: Excel charts are powerful - use them to make data more digestible.
- Handle Large Data Carefully: For files with millions of rows, consider using openpyxl's read_only and write_only modes.
Excel Automation Best Practices 📋
Excel automation with openpyxl transforms you from a spreadsheet user to a spreadsheet wizard. You can process thousands of files, generate complex reports, and create interactive dashboards - all without ever opening Excel. Whether you're in finance, data analysis, or business operations, these skills will save you countless hours and eliminate human error from repetitive tasks! 🚀
Pro Tip: Think of Excel files as databases that business users can understand. Design your automated spreadsheets with the end user in mind - add clear headers, helpful formatting, data validation, and even instructions. The best automated Excel file is one that looks like it was carefully crafted by hand, but was actually generated in seconds!