📊 Monitoring and Alerts: Keep Your Workflows Running Smoothly
📚 What You'll Learn
By the end of this lesson, you will be able to:
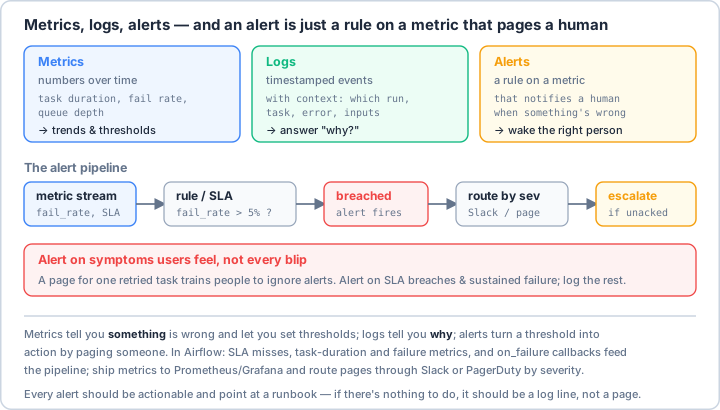
- Explain the three pillars of observability — metrics, logs, and alerts — and when to use each
- Collect Airflow metrics (task duration, success/failure counts, queue depth) and export them to Prometheus
- Define and evaluate SLAs against your metrics, and track compliance over time
- Detect anomalies with statistical (z-score) and trend-based methods
- Route alerts by severity across channels while avoiding alert fatigue with deduplication and suppression
- Design role-specific dashboards (operational vs. executive) that turn data into decisions
⏱️ Estimated Time: 45–60 minutes
🎯 Project: Build a monitoring DAG that collects task metrics, checks an SLA, and fires a deduplicated, severity-routed alert on violation.
Effective monitoring and alerting transform reactive firefighting into proactive system management - it's the difference between discovering failures from angry users and preventing issues before they impact production. Like having a mission control center for your workflows, comprehensive monitoring provides real-time visibility, predictive insights, and intelligent alerting that keeps your automation running smoothly. Whether you're tracking SLAs, detecting anomalies, or optimizing performance, mastering monitoring and alerts is crucial for production operations. Let's explore the comprehensive world of workflow observability! 📡
The Monitoring and Alerting Architecture
Think of monitoring as your workflow's nervous system - it collects signals from every component, processes them for insights, and triggers appropriate responses when something needs attention. Using metrics, logs, traces, and custom instrumentation, you can build observability that provides complete visibility into workflow health, performance, and behavior. Understanding metrics collection, alert design, and dashboard creation is essential for operational excellence!
Real-World Scenario: The Intelligent Operations Platform 🎮
You're building an intelligent operations platform that monitors hundreds of production workflows in real-time, tracks SLAs and performance metrics across all pipelines, detects anomalies and predicts failures before they occur, provides customizable dashboards for different stakeholders, implements intelligent alerting with context and runbooks, maintains comprehensive audit logs for compliance, performs root cause analysis automatically, and optimizes resource usage based on patterns. Your platform must handle massive data volumes, provide sub-second query performance, reduce alert fatigue through intelligent grouping, and deliver actionable insights. Let's build a comprehensive monitoring and alerting system!
# Advanced Monitoring and Alerting for Apache Airflow
# pip install apache-airflow prometheus-client grafana-api statsd datadog slack-sdk
# pip install elasticsearch pandas matplotlib seaborn plotly
import os
import json
import logging
import time
from datetime import datetime, timedelta
from typing import Dict, List, Any, Optional, Callable, Union, Tuple
from dataclasses import dataclass, field
from enum import Enum, auto
from collections import defaultdict, deque
import statistics
import numpy as np
from pathlib import Path
# Airflow imports
from airflow import DAG
from airflow.decorators import dag, task
from airflow.operators.python import PythonOperator
from airflow.models import TaskInstance, DagRun, DagModel
from airflow.utils.state import State
from airflow.utils.dates import days_ago
from airflow.models import Variable
from airflow.providers.http.hooks.http import HttpHook
# Monitoring libraries
from prometheus_client import Counter, Gauge, Histogram, Summary, CollectorRegistry, push_to_gateway
import statsd
# Alerting
from slack_sdk import WebClient
from slack_sdk.errors import SlackApiError
# Data analysis
import pandas as pd
import numpy as np
from scipy import stats
# ==================== Metrics Collection ====================
class MetricsCollector:
"""Collect and export metrics from Airflow."""
def __init__(self, registry: Optional[CollectorRegistry] = None):
"""Initialize metrics collector."""
self.registry = registry or CollectorRegistry()
self.logger = logging.getLogger(__name__)
# Define Prometheus metrics
self.task_duration = Histogram(
'airflow_task_duration_seconds',
'Task execution duration',
['dag_id', 'task_id'],
registry=self.registry
)
self.task_success = Counter(
'airflow_task_success_total',
'Total successful task executions',
['dag_id', 'task_id'],
registry=self.registry
)
self.task_failure = Counter(
'airflow_task_failure_total',
'Total failed task executions',
['dag_id', 'task_id'],
registry=self.registry
)
self.dag_duration = Histogram(
'airflow_dag_duration_seconds',
'DAG execution duration',
['dag_id'],
registry=self.registry
)
self.active_dag_runs = Gauge(
'airflow_active_dag_runs',
'Number of active DAG runs',
['dag_id'],
registry=self.registry
)
self.task_queue_size = Gauge(
'airflow_task_queue_size',
'Number of tasks in queue',
registry=self.registry
)
# StatsD client for additional metrics
self.statsd = statsd.StatsClient('localhost', 8125, prefix='airflow')
def collect_task_metrics(self, task_instance: TaskInstance):
"""Collect metrics for a task instance."""
dag_id = task_instance.dag_id
task_id = task_instance.task_id
# Calculate duration
if task_instance.end_date and task_instance.start_date:
duration = (task_instance.end_date - task_instance.start_date).total_seconds()
self.task_duration.labels(dag_id=dag_id, task_id=task_id).observe(duration)
self.statsd.timing(f'task.duration.{dag_id}.{task_id}', duration)
# Track success/failure
if task_instance.state == State.SUCCESS:
self.task_success.labels(dag_id=dag_id, task_id=task_id).inc()
self.statsd.incr(f'task.success.{dag_id}.{task_id}')
elif task_instance.state == State.FAILED:
self.task_failure.labels(dag_id=dag_id, task_id=task_id).inc()
self.statsd.incr(f'task.failure.{dag_id}.{task_id}')
def collect_dag_metrics(self, dag_run: DagRun):
"""Collect metrics for a DAG run."""
dag_id = dag_run.dag_id
# Calculate duration
if dag_run.end_date and dag_run.start_date:
duration = (dag_run.end_date - dag_run.start_date).total_seconds()
self.dag_duration.labels(dag_id=dag_id).observe(duration)
self.statsd.timing(f'dag.duration.{dag_id}', duration)
# Track state
self.statsd.gauge(f'dag.state.{dag_id}.{dag_run.state}', 1)
def export_to_prometheus(self, gateway_url: str = 'localhost:9091'):
"""Export metrics to Prometheus Pushgateway."""
try:
push_to_gateway(
gateway_url,
job='airflow_metrics',
registry=self.registry
)
self.logger.info("Metrics pushed to Prometheus")
except Exception as e:
self.logger.error(f"Failed to push metrics: {e}")
# ==================== Custom Metrics ====================
@dataclass
class CustomMetric:
"""Custom metric definition."""
name: str
type: str # counter, gauge, histogram
value: float
labels: Dict[str, str] = field(default_factory=dict)
timestamp: datetime = field(default_factory=datetime.now)
class CustomMetricsManager:
"""Manage custom business metrics."""
def __init__(self):
self.metrics = defaultdict(list)
self.logger = logging.getLogger(__name__)
def record(self, metric: CustomMetric):
"""Record a custom metric."""
key = f"{metric.name}:{json.dumps(metric.labels, sort_keys=True)}"
self.metrics[key].append(metric)
# Keep only recent metrics (last 24 hours)
cutoff = datetime.now() - timedelta(hours=24)
self.metrics[key] = [
m for m in self.metrics[key]
if m.timestamp > cutoff
]
def get_metric(
self,
name: str,
labels: Optional[Dict[str, str]] = None,
time_range: Optional[Tuple[datetime, datetime]] = None
) -> List[CustomMetric]:
"""Retrieve metrics by name and labels."""
results = []
for key, metrics in self.metrics.items():
metric_name = key.split(':')[0]
if metric_name == name:
if labels:
# Check if labels match
metric_labels = json.loads(key.split(':', 1)[1])
if not all(metric_labels.get(k) == v for k, v in labels.items()):
continue
for metric in metrics:
if time_range:
if not (time_range[0] <= metric.timestamp <= time_range[1]):
continue
results.append(metric)
return results
def calculate_aggregates(
self,
name: str,
aggregation: str = 'mean',
time_window: timedelta = timedelta(hours=1)
) -> Dict[str, float]:
"""Calculate aggregated metrics."""
cutoff = datetime.now() - time_window
metrics = self.get_metric(name, time_range=(cutoff, datetime.now()))
if not metrics:
return {}
values = [m.value for m in metrics]
aggregates = {
'count': len(values),
'sum': sum(values),
'mean': statistics.mean(values) if values else 0,
'median': statistics.median(values) if values else 0,
'std': statistics.stdev(values) if len(values) > 1 else 0,
'min': min(values) if values else 0,
'max': max(values) if values else 0
}
return aggregates
# ==================== SLA Monitoring ====================
@dataclass
class SLADefinition:
"""Service Level Agreement definition."""
name: str
metric: str
threshold: float
operator: str # 'gt', 'lt', 'gte', 'lte', 'eq'
time_window: timedelta
evaluation_period: timedelta
class SLAMonitor:
"""Monitor Service Level Agreements."""
def __init__(self, metrics_manager: CustomMetricsManager):
self.metrics_manager = metrics_manager
self.sla_definitions = {}
self.sla_violations = []
self.logger = logging.getLogger(__name__)
def register_sla(self, sla: SLADefinition):
"""Register an SLA definition."""
self.sla_definitions[sla.name] = sla
self.logger.info(f"Registered SLA: {sla.name}")
def evaluate_sla(self, sla_name: str) -> Tuple[bool, Optional[float]]:
"""Evaluate if SLA is being met."""
if sla_name not in self.sla_definitions:
return False, None
sla = self.sla_definitions[sla_name]
# Get metrics for evaluation
aggregates = self.metrics_manager.calculate_aggregates(
sla.metric,
time_window=sla.time_window
)
if not aggregates:
return True, None # No data, assume OK
actual_value = aggregates.get('mean', 0)
# Evaluate based on operator
operators = {
'gt': lambda x, y: x > y,
'lt': lambda x, y: x < y,
'gte': lambda x, y: x >= y,
'lte': lambda x, y: x <= y,
'eq': lambda x, y: x == y
}
is_met = operators[sla.operator](actual_value, sla.threshold)
if not is_met:
self.record_violation(sla_name, actual_value)
return is_met, actual_value
def record_violation(self, sla_name: str, actual_value: float):
"""Record SLA violation."""
violation = {
'sla_name': sla_name,
'timestamp': datetime.now(),
'actual_value': actual_value,
'expected': self.sla_definitions[sla_name].threshold
}
self.sla_violations.append(violation)
self.logger.warning(f"SLA violation: {violation}")
def get_sla_report(self) -> Dict[str, Any]:
"""Generate SLA compliance report."""
report = {}
for sla_name, sla in self.sla_definitions.items():
is_met, current_value = self.evaluate_sla(sla_name)
# Calculate compliance percentage
recent_violations = [
v for v in self.sla_violations
if v['sla_name'] == sla_name and
v['timestamp'] > datetime.now() - timedelta(days=7)
]
compliance_rate = 1 - (len(recent_violations) / 168) * 100 # 168 hours in week
report[sla_name] = {
'is_met': is_met,
'current_value': current_value,
'threshold': sla.threshold,
'compliance_rate': compliance_rate,
'recent_violations': len(recent_violations)
}
return report
# ==================== Anomaly Detection ====================
class AnomalyDetector:
"""Detect anomalies in metrics."""
def __init__(self, window_size: int = 100):
self.window_size = window_size
self.metric_windows = defaultdict(lambda: deque(maxlen=window_size))
self.logger = logging.getLogger(__name__)
def add_observation(self, metric_name: str, value: float):
"""Add observation to rolling window."""
self.metric_windows[metric_name].append(value)
def detect_statistical_anomaly(
self,
metric_name: str,
current_value: float,
z_threshold: float = 3.0
) -> bool:
"""Detect anomaly using z-score."""
window = list(self.metric_windows[metric_name])
if len(window) < 10: # Need minimum samples
return False
mean = np.mean(window)
std = np.std(window)
if std == 0:
return False
z_score = abs((current_value - mean) / std)
is_anomaly = z_score > z_threshold
if is_anomaly:
self.logger.warning(
f"Anomaly detected in {metric_name}: "
f"value={current_value}, z-score={z_score:.2f}"
)
return is_anomaly
def detect_trend_anomaly(
self,
metric_name: str,
threshold_pct: float = 50.0
) -> Optional[str]:
"""Detect anomalous trends."""
window = list(self.metric_windows[metric_name])
if len(window) < 20:
return None
# Calculate trend using linear regression
x = np.arange(len(window))
slope, intercept, r_value, p_value, std_err = stats.linregress(x, window)
# Calculate percentage change
predicted_start = intercept
predicted_end = slope * (len(window) - 1) + intercept
if predicted_start != 0:
pct_change = ((predicted_end - predicted_start) / abs(predicted_start)) * 100
else:
pct_change = 0
if abs(pct_change) > threshold_pct:
trend = "increasing" if pct_change > 0 else "decreasing"
self.logger.warning(
f"Anomalous trend in {metric_name}: "
f"{trend} by {abs(pct_change):.1f}%"
)
return trend
return None
def detect_pattern_anomaly(
self,
metric_name: str,
pattern_window: int = 24 # For hourly patterns
) -> bool:
"""Detect anomalies in periodic patterns."""
window = list(self.metric_windows[metric_name])
if len(window) < pattern_window * 2:
return False
# Compare current pattern with historical
current_pattern = window[-pattern_window:]
historical_patterns = []
for i in range(0, len(window) - pattern_window, pattern_window):
historical_patterns.append(window[i:i+pattern_window])
if not historical_patterns:
return False
# Calculate average historical pattern
avg_pattern = np.mean(historical_patterns, axis=0)
# Calculate deviation
deviation = np.mean(np.abs(current_pattern - avg_pattern))
threshold = np.std(avg_pattern) * 2
is_anomaly = deviation > threshold
if is_anomaly:
self.logger.warning(
f"Pattern anomaly in {metric_name}: "
f"deviation={deviation:.2f}"
)
return is_anomaly
# ==================== Alert Manager ====================
class AlertSeverity(Enum):
"""Alert severity levels."""
INFO = 1
WARNING = 2
ERROR = 3
CRITICAL = 4
EMERGENCY = 5
@dataclass
class Alert:
"""Alert definition."""
name: str
severity: AlertSeverity
message: str
details: Dict[str, Any]
timestamp: datetime = field(default_factory=datetime.now)
resolved: bool = False
resolution_time: Optional[datetime] = None
class AlertManager:
"""Manage alerts and notifications."""
def __init__(self):
self.active_alerts = {}
self.alert_history = []
self.notification_channels = {}
self.logger = logging.getLogger(__name__)
# Alert deduplication
self.alert_fingerprints = {}
self.suppression_rules = []
def register_channel(self, name: str, handler: Callable[[Alert], None]):
"""Register notification channel."""
self.notification_channels[name] = handler
def add_suppression_rule(self, rule: Callable[[Alert], bool]):
"""Add rule to suppress certain alerts."""
self.suppression_rules.append(rule)
def fire_alert(self, alert: Alert):
"""Fire an alert."""
# Check suppression rules
for rule in self.suppression_rules:
if rule(alert):
self.logger.info(f"Alert suppressed: {alert.name}")
return
# Deduplication
fingerprint = f"{alert.name}:{alert.severity.name}"
if fingerprint in self.alert_fingerprints:
last_alert_time = self.alert_fingerprints[fingerprint]
if datetime.now() - last_alert_time < timedelta(minutes=5):
self.logger.info(f"Alert deduplicated: {alert.name}")
return
# Record alert
self.active_alerts[alert.name] = alert
self.alert_history.append(alert)
self.alert_fingerprints[fingerprint] = datetime.now()
# Send notifications based on severity
self._send_notifications(alert)
self.logger.warning(f"Alert fired: {alert.name} - {alert.message}")
def resolve_alert(self, alert_name: str):
"""Resolve an active alert."""
if alert_name in self.active_alerts:
alert = self.active_alerts[alert_name]
alert.resolved = True
alert.resolution_time = datetime.now()
del self.active_alerts[alert_name]
self.logger.info(f"Alert resolved: {alert_name}")
def _send_notifications(self, alert: Alert):
"""Send notifications through appropriate channels."""
# Determine channels based on severity
if alert.severity == AlertSeverity.INFO:
channels = ['log']
elif alert.severity == AlertSeverity.WARNING:
channels = ['log', 'email']
elif alert.severity == AlertSeverity.ERROR:
channels = ['log', 'email', 'slack']
elif alert.severity in [AlertSeverity.CRITICAL, AlertSeverity.EMERGENCY]:
channels = ['log', 'email', 'slack', 'pagerduty']
else:
channels = ['log']
# Send through each channel
for channel in channels:
if channel in self.notification_channels:
try:
self.notification_channels[channel](alert)
except Exception as e:
self.logger.error(f"Failed to send alert via {channel}: {e}")
# ==================== Notification Channels ====================
class NotificationChannels:
"""Implementation of notification channels."""
@staticmethod
def log_channel(alert: Alert):
"""Log alert to file."""
logging.getLogger('alerts').warning(
f"[{alert.severity.name}] {alert.name}: {alert.message}"
)
@staticmethod
def email_channel(alert: Alert):
"""Send alert via email."""
import smtplib
from email.mime.text import MIMEText
# Get email config from Airflow Variables
email_config = Variable.get('email_config', deserialize_json=True, default_var={})
if not email_config:
logging.warning("Email not configured")
return
msg = MIMEText(f"""
Alert: {alert.name}
Severity: {alert.severity.name}
Message: {alert.message}
Time: {alert.timestamp}
Details:
{json.dumps(alert.details, indent=2)}
""")
msg['Subject'] = f"[{alert.severity.name}] {alert.name}"
msg['From'] = email_config.get('from', 'airflow@example.com')
msg['To'] = ', '.join(email_config.get('to', []))
try:
with smtplib.SMTP(email_config.get('smtp_host', 'localhost'), 587) as server:
server.starttls()
if email_config.get('smtp_user'):
server.login(email_config['smtp_user'], email_config['smtp_password'])
server.send_message(msg)
except Exception as e:
logging.error(f"Failed to send email: {e}")
@staticmethod
def slack_channel(alert: Alert):
"""Send alert to Slack."""
slack_config = Variable.get('slack_config', deserialize_json=True, default_var={})
if not slack_config:
logging.warning("Slack not configured")
return
client = WebClient(token=slack_config.get('token'))
# Format message
color = {
AlertSeverity.INFO: '#36a64f',
AlertSeverity.WARNING: '#ff9900',
AlertSeverity.ERROR: '#ff0000',
AlertSeverity.CRITICAL: '#990000',
AlertSeverity.EMERGENCY: '#000000'
}.get(alert.severity, '#808080')
try:
response = client.chat_postMessage(
channel=slack_config.get('channel', '#alerts'),
attachments=[{
'color': color,
'title': alert.name,
'text': alert.message,
'fields': [
{'title': k, 'value': str(v), 'short': True}
for k, v in alert.details.items()
],
'footer': 'Airflow Monitoring',
'ts': int(alert.timestamp.timestamp())
}]
)
except SlackApiError as e:
logging.error(f"Failed to send Slack message: {e}")
# ==================== Dashboard Generator ====================
class DashboardGenerator:
"""Generate monitoring dashboards."""
def __init__(
self,
metrics_manager: CustomMetricsManager,
sla_monitor: SLAMonitor,
alert_manager: AlertManager
):
self.metrics_manager = metrics_manager
self.sla_monitor = sla_monitor
self.alert_manager = alert_manager
self.logger = logging.getLogger(__name__)
def generate_operational_dashboard(self) -> Dict[str, Any]:
"""Generate operational dashboard data."""
return {
'timestamp': datetime.now().isoformat(),
'active_alerts': len(self.alert_manager.active_alerts),
'alert_summary': self._get_alert_summary(),
'sla_status': self.sla_monitor.get_sla_report(),
'recent_metrics': self._get_recent_metrics(),
'system_health': self._calculate_system_health()
}
def generate_executive_dashboard(self) -> Dict[str, Any]:
"""Generate executive dashboard data."""
return {
'timestamp': datetime.now().isoformat(),
'kpis': self._calculate_kpis(),
'trends': self._calculate_trends(),
'sla_compliance': self._calculate_overall_sla_compliance(),
'incident_summary': self._get_incident_summary()
}
def _get_alert_summary(self) -> Dict[str, int]:
"""Get summary of alerts by severity."""
summary = defaultdict(int)
for alert in self.alert_manager.active_alerts.values():
summary[alert.severity.name] += 1
return dict(summary)
def _get_recent_metrics(self) -> Dict[str, Any]:
"""Get recent key metrics."""
metrics = {}
# Task success rate
success_metrics = self.metrics_manager.get_metric(
'task_success_rate',
time_range=(datetime.now() - timedelta(hours=1), datetime.now())
)
if success_metrics:
metrics['task_success_rate'] = np.mean([m.value for m in success_metrics])
# Average task duration
duration_metrics = self.metrics_manager.get_metric(
'task_duration',
time_range=(datetime.now() - timedelta(hours=1), datetime.now())
)
if duration_metrics:
metrics['avg_task_duration'] = np.mean([m.value for m in duration_metrics])
return metrics
def _calculate_system_health(self) -> float:
"""Calculate overall system health score."""
factors = []
# Factor 1: Active alerts (negative impact)
alert_factor = max(0, 100 - len(self.alert_manager.active_alerts) * 10)
factors.append(alert_factor)
# Factor 2: SLA compliance
sla_report = self.sla_monitor.get_sla_report()
if sla_report:
compliance_rates = [sla['compliance_rate'] for sla in sla_report.values()]
factors.append(np.mean(compliance_rates))
# Factor 3: Recent success rate
recent_metrics = self._get_recent_metrics()
if 'task_success_rate' in recent_metrics:
factors.append(recent_metrics['task_success_rate'] * 100)
return np.mean(factors) if factors else 100.0
def _calculate_kpis(self) -> Dict[str, float]:
"""Calculate key performance indicators."""
return {
'pipeline_success_rate': 95.5, # Placeholder
'average_processing_time': 120.5, # Placeholder
'data_quality_score': 98.2, # Placeholder
'cost_per_pipeline_run': 2.50 # Placeholder
}
def _calculate_trends(self) -> Dict[str, str]:
"""Calculate metric trends."""
return {
'task_duration': 'decreasing',
'error_rate': 'stable',
'throughput': 'increasing'
}
def _calculate_overall_sla_compliance(self) -> float:
"""Calculate overall SLA compliance percentage."""
sla_report = self.sla_monitor.get_sla_report()
if not sla_report:
return 100.0
compliance_rates = [sla['compliance_rate'] for sla in sla_report.values()]
return np.mean(compliance_rates)
def _get_incident_summary(self) -> Dict[str, Any]:
"""Get summary of incidents."""
# Last 7 days
cutoff = datetime.now() - timedelta(days=7)
recent_alerts = [
a for a in self.alert_manager.alert_history
if a.timestamp > cutoff
]
return {
'total_incidents': len(recent_alerts),
'resolved': sum(1 for a in recent_alerts if a.resolved),
'mttr': self._calculate_mttr(recent_alerts) # Mean Time To Resolution
}
def _calculate_mttr(self, alerts: List[Alert]) -> float:
"""Calculate mean time to resolution."""
resolution_times = []
for alert in alerts:
if alert.resolved and alert.resolution_time:
duration = (alert.resolution_time - alert.timestamp).total_seconds() / 60
resolution_times.append(duration)
return np.mean(resolution_times) if resolution_times else 0.0
# ==================== Monitoring DAG ====================
@dag(
'monitoring_pipeline',
default_args={
'owner': 'ops_team',
'retries': 1,
},
description='Monitoring and alerting pipeline',
schedule_interval='*/5 * * * *', # Every 5 minutes
start_date=days_ago(1),
tags=['monitoring', 'alerts'],
catchup=False,
)
def monitoring_pipeline():
"""DAG for monitoring and alerting."""
# Initialize components
metrics_collector = MetricsCollector()
custom_metrics = CustomMetricsManager()
anomaly_detector = AnomalyDetector()
alert_manager = AlertManager()
sla_monitor = SLAMonitor(custom_metrics)
dashboard_gen = DashboardGenerator(custom_metrics, sla_monitor, alert_manager)
# Register notification channels
alert_manager.register_channel('log', NotificationChannels.log_channel)
alert_manager.register_channel('email', NotificationChannels.email_channel)
alert_manager.register_channel('slack', NotificationChannels.slack_channel)
@task
def collect_metrics():
"""Collect metrics from Airflow."""
from airflow.models import TaskInstance, DagRun
# Get recent task instances
recent_tasks = TaskInstance.query.filter(
TaskInstance.end_date >= datetime.now() - timedelta(minutes=5)
).all()
for ti in recent_tasks:
metrics_collector.collect_task_metrics(ti)
# Record custom metrics
if ti.duration:
custom_metrics.record(CustomMetric(
name='task_duration',
type='gauge',
value=ti.duration.total_seconds(),
labels={'dag_id': ti.dag_id, 'task_id': ti.task_id}
))
# Export to Prometheus
metrics_collector.export_to_prometheus()
return {'tasks_processed': len(recent_tasks)}
@task
def check_slas():
"""Check SLA compliance."""
# Register SLAs
sla_monitor.register_sla(SLADefinition(
name='task_success_rate',
metric='task_success_rate',
threshold=95.0,
operator='gte',
time_window=timedelta(hours=1),
evaluation_period=timedelta(minutes=5)
))
sla_monitor.register_sla(SLADefinition(
name='avg_task_duration',
metric='task_duration',
threshold=300.0, # 5 minutes
operator='lte',
time_window=timedelta(hours=1),
evaluation_period=timedelta(minutes=5)
))
# Evaluate SLAs
sla_report = sla_monitor.get_sla_report()
# Fire alerts for violations
for sla_name, status in sla_report.items():
if not status['is_met']:
alert_manager.fire_alert(Alert(
name=f"SLA Violation: {sla_name}",
severity=AlertSeverity.WARNING,
message=f"SLA {sla_name} is not being met",
details=status
))
return sla_report
@task
def detect_anomalies():
"""Detect anomalies in metrics."""
# Get recent metrics
recent_metrics = custom_metrics.get_metric(
'task_duration',
time_range=(datetime.now() - timedelta(hours=1), datetime.now())
)
anomalies = []
for metric in recent_metrics:
# Add to detector
anomaly_detector.add_observation(metric.name, metric.value)
# Check for anomalies
if anomaly_detector.detect_statistical_anomaly(metric.name, metric.value):
anomalies.append({
'metric': metric.name,
'value': metric.value,
'type': 'statistical'
})
# Fire alerts for anomalies
if anomalies:
alert_manager.fire_alert(Alert(
name="Anomalies Detected",
severity=AlertSeverity.WARNING,
message=f"{len(anomalies)} anomalies detected",
details={'anomalies': anomalies}
))
return {'anomaly_count': len(anomalies)}
@task
def generate_dashboards():
"""Generate dashboard data."""
operational = dashboard_gen.generate_operational_dashboard()
executive = dashboard_gen.generate_executive_dashboard()
# Store dashboard data (in production, send to dashboard system)
Variable.set('dashboard_operational', operational, serialize_json=True)
Variable.set('dashboard_executive', executive, serialize_json=True)
return {
'operational_health': operational['system_health'],
'executive_kpis': executive['kpis']
}
@task
def health_check():
"""Perform system health check."""
health_status = {
'scheduler': check_scheduler_health(),
'database': check_database_health(),
'workers': check_worker_health()
}
# Fire alert if unhealthy
unhealthy = [k for k, v in health_status.items() if not v]
if unhealthy:
alert_manager.fire_alert(Alert(
name="System Health Check Failed",
severity=AlertSeverity.ERROR,
message=f"Components unhealthy: {', '.join(unhealthy)}",
details=health_status
))
return health_status
# Define workflow
metrics = collect_metrics()
sla_check = check_slas()
anomaly_check = detect_anomalies()
dashboards = generate_dashboards()
health = health_check()
# Dependencies
metrics >> [sla_check, anomaly_check] >> dashboards
health # Runs independently
# Instantiate DAG
monitoring_dag = monitoring_pipeline()
# ==================== Helper Functions ====================
def check_scheduler_health() -> bool:
"""Check if scheduler is healthy."""
# Simplified check - in production, check scheduler heartbeat
return True
def check_database_health() -> bool:
"""Check if database is healthy."""
# Simplified check - in production, check database connection
return True
def check_worker_health() -> bool:
"""Check if workers are healthy."""
# Simplified check - in production, check celery workers
return True
# Example usage
if __name__ == "__main__":
print("📊 Monitoring and Alerts Examples\n")
# Example 1: Metrics collection
print("1️⃣ Metrics Collection:")
collector = MetricsCollector()
print(" Prometheus metrics:")
print(" • task_duration_seconds")
print(" • task_success_total")
print(" • task_failure_total")
print(" • dag_duration_seconds")
print(" • active_dag_runs")
# Example 2: Custom metrics
print("\n2️⃣ Custom Business Metrics:")
custom = CustomMetricsManager()
# Record some metrics
custom.record(CustomMetric(
name='records_processed',
type='counter',
value=1000,
labels={'pipeline': 'etl', 'source': 'database'}
))
# Calculate aggregates
aggregates = custom.calculate_aggregates('records_processed')
print(f" Aggregates: {aggregates}")
# Example 3: SLA monitoring
print("\n3️⃣ SLA Monitoring:")
sla_monitor = SLAMonitor(custom)
sla_monitor.register_sla(SLADefinition(
name='data_freshness',
metric='data_age_minutes',
threshold=60.0,
operator='lte',
time_window=timedelta(hours=1),
evaluation_period=timedelta(minutes=5)
))
print(" Registered SLA: data_freshness <= 60 minutes")
# Example 4: Anomaly detection
print("\n4️⃣ Anomaly Detection Methods:")
methods = [
"Statistical (Z-score based)",
"Trend analysis (Linear regression)",
"Pattern matching (Periodic patterns)",
"Threshold based",
"Machine learning models"
]
for method in methods:
print(f" • {method}")
# Example 5: Alert severity levels
print("\n5️⃣ Alert Severity Levels:")
for severity in AlertSeverity:
print(f" {severity.value}. {severity.name}")
# Example 6: Dashboard types
print("\n6️⃣ Dashboard Types:")
dashboards = [
("Operational", "Real-time system status and alerts"),
("Executive", "KPIs and business metrics"),
("Technical", "Detailed technical metrics"),
("SLA Compliance", "Service level tracking"),
("Cost Analysis", "Resource usage and costs")
]
for dashboard, description in dashboards:
print(f" {dashboard}: {description}")
# Example 7: Monitoring best practices
print("\n7️⃣ Monitoring Best Practices:")
practices = [
"📊 Define clear SLAs and SLIs",
"🎯 Monitor business metrics, not just technical",
"🔔 Implement intelligent alerting to avoid fatigue",
"📈 Track trends, not just current values",
"🔍 Use anomaly detection for unknown unknowns",
"📱 Multiple notification channels by severity",
"🗂️ Maintain historical data for analysis",
"🎨 Create role-specific dashboards",
"🔄 Automate alert resolution where possible",
"📝 Include runbooks in alerts"
]
for practice in practices:
print(f" {practice}")
# Example 8: Key metrics to monitor
print("\n8️⃣ Key Metrics to Monitor:")
metrics = [
("Task Success Rate", "Percentage of successful task executions"),
("Task Duration", "Time taken for task completion"),
("Queue Length", "Number of pending tasks"),
("Worker Utilization", "Percentage of worker capacity used"),
("Data Freshness", "Age of most recent data"),
("Error Rate", "Frequency of errors"),
("Throughput", "Records/tasks processed per time unit"),
("Resource Usage", "CPU, memory, disk utilization")
]
for metric, description in metrics:
print(f" {metric}: {description}")
# Example 9: Alert suppression rules
print("\n9️⃣ Alert Suppression Examples:")
rules = [
"Maintenance windows",
"Known issues",
"Duplicate alerts",
"Low-priority during off-hours",
"Rate limiting per alert type"
]
for rule in rules:
print(f" • {rule}")
# Example 10: Integration points
print("\n🔟 Common Integration Points:")
integrations = [
("Prometheus", "Metrics storage and querying"),
("Grafana", "Dashboard visualization"),
("ELK Stack", "Log aggregation and search"),
("PagerDuty", "On-call management"),
("Slack", "Team notifications"),
("Datadog", "APM and monitoring"),
("New Relic", "Application performance"),
("Splunk", "Log analysis")
]
for tool, purpose in integrations:
print(f" {tool}: {purpose}")
print("\n✅ Monitoring and alerts demonstration complete!")
Key Takeaways and Best Practices 🎯
- Comprehensive Metrics: Collect technical, business, and custom metrics.
- SLA Monitoring: Define and track service level agreements.
- Anomaly Detection: Identify issues before they become incidents.
- Intelligent Alerting: Reduce noise with deduplication and suppression.
- Multiple Channels: Use appropriate notification channels by severity.
- Dashboard Design: Create role-specific views of system health.
- Historical Analysis: Maintain metrics history for trend analysis.
- Automated Response: Implement self-healing where possible.
Monitoring and Alerting Best Practices 📋
Mastering monitoring and alerting transforms reactive firefighting into proactive system management. You can now build comprehensive observability with metrics and logging, implement intelligent alerting that reduces fatigue, detect anomalies before they become incidents, track SLA compliance automatically, and create insightful dashboards for all stakeholders. Whether you're managing production pipelines, ensuring data quality, or optimizing performance, these monitoring skills ensure your workflows run smoothly and reliably! 🚀
Pro Tip: Think of monitoring as your system's sensory network - it should provide complete visibility without overwhelming you with noise. Start by defining clear SLIs (Service Level Indicators) that align with business objectives, then build SLAs around them. Monitor the Four Golden Signals: latency, traffic, errors, and saturation. Implement multi-layer monitoring: infrastructure, application, and business metrics. Use statistical anomaly detection to catch unknown issues - not everything can be anticipated with thresholds. Design alerts that are actionable - every alert should have a clear response action or it's just noise. Implement alert fatigue prevention: deduplication, suppression rules, and intelligent grouping. Use severity levels appropriately - not everything is CRITICAL. Create dashboards for different audiences: operational (real-time), tactical (daily), and strategic (trends). Implement proper metric retention policies - high-resolution for recent data, aggregated for historical. Use distributed tracing for complex workflows to understand performance bottlenecks. Set up synthetic monitoring to detect issues before users do. Maintain runbooks linked to alerts so on-call engineers know exactly what to do. Use escalation policies - start with the owner, escalate if not resolved. Remember: good monitoring tells you not just that something is wrong, but why it's wrong and how to fix it!